Lens Performance Overlay
Overview
The Lens Performance Overlay allows you to view performance data in real time overlaid on the Spectacles display to monitor the efficiency of your draft Lenses.
Spectacles Monitor provides similar functionality in Lens Studio. The Lens Profiler Overlay consumes some Lens Power, resulting in a lower number in the Overlay compared to Spectacles Monitor when both are active. To get more precise numbers in Spectacles Monitor, turn off the Profiler Overlay.
For more information, refer to Spectacles Monitor.
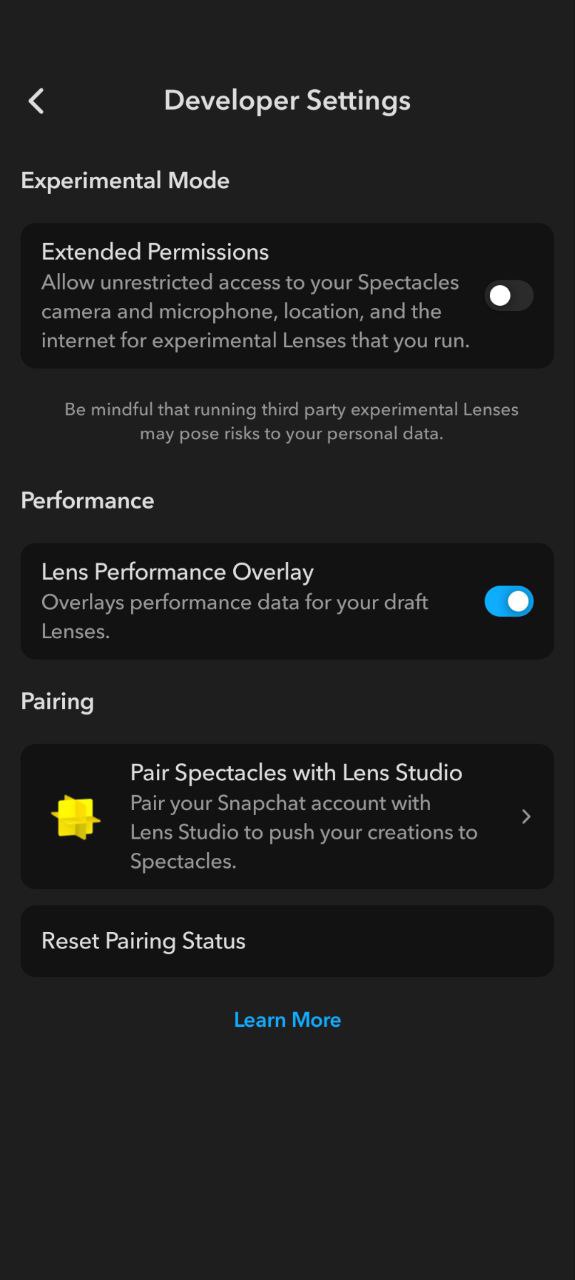
Enabling Lens Performance Overlay
Enable the Lens Performance Overlay through the Spectacles App under Developer Settings.
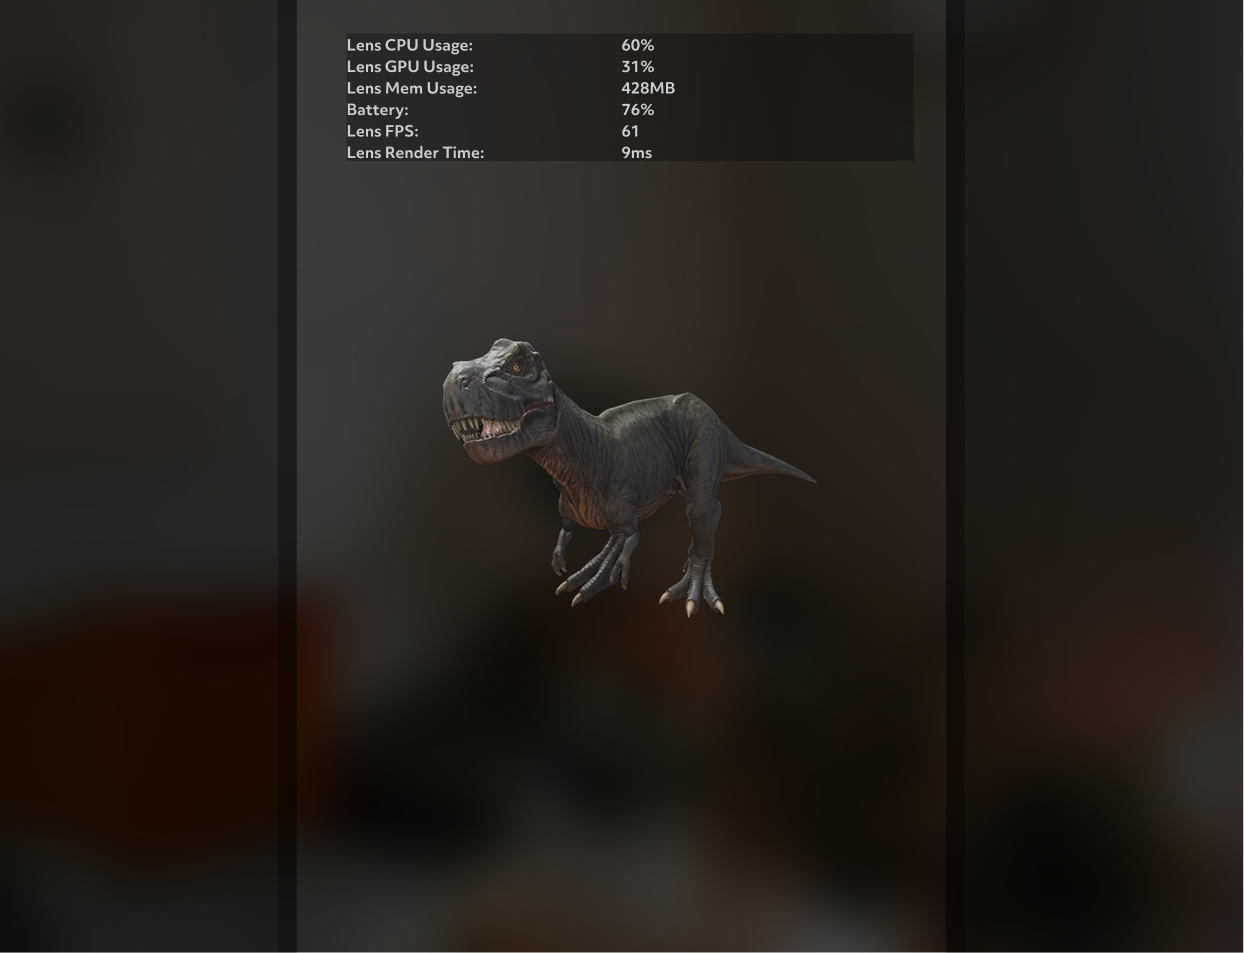
Performance Data Types
The Lens Performance Overlay provides five types of performance data for monitoring your Lens in real time:
- Lens CPU Usage
- Lens GPU Usage
- Battery level
- Lens FPS
- Lens Render Time
Lens FPS
FPS, or Frames Per Second, measures how many individual images (or frames) the Spectacles display renders per second. To ensure your Lens feels seamless to users, it should run close to 60 FPS.
When FPS drops below 60, it's a clear indicator that your Lens is over budget and needs optimization. This typically happens when CPU, GPU or Memory usage is too high, or when complex rendering operations are taking too long to complete each frame.
Lens CPU Usage
Lens CPU Usage shows the percentage of CPU resources your Lens is currently consuming. High CPU usage can impact overall device performance and battery life.
Common causes of high CPU usage:
- Complex scripts with heavy computation
- Frequent object instantiation or destruction
- Inefficient loops or calculations
- Machine learning model inference
Optimization:
- Reduce script complexity and frequency of updates
- Use object pooling instead of frequent instantiation
- Cache calculations when possible
- Optimize or reduce ML model complexity
Lens GPU Usage
Lens GPU Usage displays the percentage of GPU resources being utilized by your Lens for rendering operations. High GPU usage typically indicates complex rendering that needs optimization.
Common causes of high GPU usage:
- Complex materials and shaders
- High polygon count meshes
- Multiple VFX or screen overlays
- High-resolution textures
- Overdraw from overlapping transparent objects, particle effects, materials
Optimization:
- Simplify materials and reduce shader complexity
- Use lower polygon meshes
- Reduce or combine VFX and screen overlays
- Compress and reduce texture resolution
- Minimize transparent overlapping objects and particle effects
Lens Memory Usage
Lens Memory Usage indicates the amount of memory your Lens is consuming on the Spectacles device. Excessive memory usage can lead to performance degradation and crashes.
Common causes of high memory usage:
- Large textures and assets
- Memory leaks from scripts
- Retaining unused objects in memory
Optimization:
- Use compressed textures and optimize asset sizes
- Regularly clean up unused objects in scripts
- Profile memory usage to identify and fix leaks
Battery Level
Battery Level indicates the current charge remaining on the Spectacles device. This helps you understand how your Lens usage affects battery consumption and plan testing sessions accordingly.
Lens Render Time
Lens Render Time measures how long it takes to render each frame of your Lens, typically displayed in milliseconds. Lower render times indicate more efficient rendering and contribute to maintaining stable frame rates and better user experience.
Keep render time under ~16ms to maintain 60 FPS (1000ms ÷ 60 frames = 16.67ms per frame). Lower than 60 FPS can be an indicator the Lens is over budget.
Understanding Performance Budgets
Each Lens operates within a runtime power budget, where 100% CPU/GPU in the performance overlay HUD represents the target performance budget. When a Lens goes above that, it can become thermally runtime constrained rather than battery runtime constrained, which may cause throttling, standby, or shutdowns as needed.
Performance Zones
Here's a simple way to think about the performance zones:
- Under 100% CPU/GPU: Lens is battery runtime constrained and running efficiently within budget. This is the target zone.
- 100% - 125% CPU/GPU: Lens is thermally runtime constrained; performance may throttle or runtime may shorten.
- Over 125% CPU/GPU: Lens is significantly thermally constrained and will very likely trigger thermal standby or shutdowns, especially when used in combination with other power-intensive operations such as Capture.
- Thermal Standby occurs when the device temperature exceeds safe operating limits. In this state, the device reduces performance to cool down, which can lead to a degraded user experience.
- Thermal Shutdown is a protective measure where the device powers off to prevent damage from overheating. This results in an immediate end to the Lens experience.
Factors Affecting Performance Budget
A higher starting device temperature for instance, due to prior use of an over-budget Lens or a warmer ambient temperature will reduce the available budget. Other factors that can impact performance include:
- Device temperature from prior use
- Ambient temperature
- How you are using the Lens (e.g. using the Lens under lowlight conditions)
- Concurrent power-intensive operations (e.g. Capture)
- SLAM/VIO/Mapping operations. For more information, see Environment Setup Guidance.
Optimization Guidelines
If your Lens has higher CPU/GPU or memory trends, it likely needs optimization. Here are key strategies:
- Simplify materials and reduce shader complexity
- Simplify high resolution textures
- Monitor memory usage in HUD
- Check FPS performance
- Reduce polygon counts on 3D models
- Optimize script performance
Additional Resources
For detailed profiling and optimization guidance, check out:
- Spectacles Monitor - to visualize CPU/GPU usage and runtime budgets
- Optimizing Lens Performance - for best practices and tips
- AR Lens Developer Checklist for Spectacles - for comprehensive optimization checklist