Alpaca API Example
Alpaca API module is available in the APIs category of Lens Studio Asset Library. Import the asset to your project and refer to Alpaca API API reference to parse the response.
Scripting Example
Below is a simple example script demonstrating how to use the API, along with links to documentation on how to interpret the data returned by the Alpaca API. This script provides options to print the returned data from various endpoints.
- Import the
Alpaca APImodule from the Asset Library. - Create a new JavaScript file, copy the following code, and save the file.
// @input string ticker = "SNAP" {"hint" : "Specify ticker symbol"}
// @input Asset.RemoteServiceModule remoteServiceModule

function handleAPIResponse(response, cb) {
  if (response.statusCode !== 1) {
    print('ERROR: The API call did not succeed!. Please check your request');
    cb(true);
  } else {
    try {
      var parsedBody = JSON.parse(response.body);
      if (cb) {
        cb(false, parsedBody);
      }
    } catch (e) {
      print('ERROR: Failed to parse response');
      if (cb) {
        cb(true);
      }
    }
  }
}

// Get Trades
var getTrades = function (symbol, cb) {
  var request = global.RemoteApiRequest.create();
  request.endpoint = 'get_trades';
  request.parameters = { symbol: symbol };
  script.remoteServiceModule.performApiRequest(request, function (response) {
    handleAPIResponse(response, cb);
  });
};

getTrades(script.ticker, function (err, parsedBody) {
  if (err) {
    print('ERROR: API did not return correctly');
  } else {
    print(JSON.stringify(parsedBody.trades[0]));
    // Read about the parsed bodys data here https://alpaca.markets/docs/api-documentation/api-v2/market-data/alpaca-data-api-v2/historical/#trades
  }
});

// Get Latest Trade
var getLatestTrade = function (symbol, cb) {
  var request = global.RemoteApiRequest.create();
  request.endpoint = 'get_latest_trades';
  request.parameters = { symbol: symbol };
  script.remoteServiceModule.performApiRequest(request, function (response) {
    if (response.statusCode !== 1) {
      print(
        'ERROR: The getLatestTrade call did not succeed! Please check your request.'
      );
    } else if (cb) {
      handleAPIResponse(response, cb);
    }
  });
};

getLatestTrade(script.ticker, function (err, parsedBody) {
  if (err) {
    print('ERROR: API did not return correctly');
  } else {
    print(JSON.stringify(parsedBody));
    // Read about the parsed bodys data here https://alpaca.markets/docs/api-documentation/api-v2/market-data/alpaca-data-api-v2/historical/#latest-trade
  }
});

// Get Quotes
var getQuotes = function (symbol, cb) {
  var request = global.RemoteApiRequest.create();
  request.endpoint = 'get_quotes';
  request.parameters = { symbol: symbol };
  script.remoteServiceModule.performApiRequest(request, function (response) {
    if (cb) {
      handleAPIResponse(response, cb);
    }
  });
};

getQuotes(script.ticker, function (err, parsedBody) {
  if (err) {
    print('ERROR: API did not return correctly');
  } else {
    print(JSON.stringify(parsedBody.quotes[0]));
    // Read about the parsed bodys data here https://alpaca.markets/docs/api-documentation/api-v2/market-data/alpaca-data-api-v2/historical/#quotes
  }
});

// Get Latest Quote
var getLatestQuote = function (symbol, cb) {
  var request = global.RemoteApiRequest.create();
  request.endpoint = 'get_latest_quotes';
  request.parameters = { symbol: symbol };
  script.remoteServiceModule.performApiRequest(request, function (response) {
    if (cb) {
      handleAPIResponse(response, cb);
    }
  });
};

getLatestQuote(script.ticker, function (err, parsedBody) {
  if (err) {
    print('ERROR: API did not return correctly');
  } else {
    print(JSON.stringify(parsedBody));
    // Read about the parsed bodys data here https://alpaca.markets/docs/api-documentation/api-v2/market-data/alpaca-data-api-v2/historical/#latest-quote
  }
});

// Get Bars
var getBars = function (
  symbol,
  start,
  end,
  limit,
  page_token,
  timeframe,
  adjustment,
  cb
) {
  var request = global.RemoteApiRequest.create();
  request.endpoint = 'get_bars';
  request.parameters = {
    symbol: symbol,
    start: start,
    end: end,
    limit: limit,
    page_token: page_token,
    timeframe: timeframe,
    adjustment: adjustment,
  };
  script.remoteServiceModule.performApiRequest(request, function (response) {
    if (cb) {
      handleAPIResponse(response, cb);
    }
  });
};

// Alpaca API requires calls to be 15 minutes ago or more
var now = new Date();
now = new Date(now.getTime() - 30 * 60 * 1000);
var sevenDaysAgo = 60 * 60 * 24 * 7 * 1000;
var oneWeekAgo = new Date(now.getTime() - sevenDaysAgo);

getBars(
  script.ticker,
  oneWeekAgo.toISOString(),
  now.toISOString(),
  undefined,
  undefined,
  '1Hour',
  undefined,
  function (err, body) {
    if (err) {
      print('ERROR: API did not return correctly');
    } else {
      print(JSON.stringify(body.bars[0]));
      // Read about the parsed bodys data here https://alpaca.markets/docs/api-documentation/api-v2/market-data/alpaca-data-api-v2/historical/#bars
    }
  }
);

// Get Snapshot

var getSnapshot = function (symbol, cb) {
  var request = global.RemoteApiRequest.create();
  request.endpoint = 'get_snapshot';
  request.parameters = { symbol: symbol };
  script.remoteServiceModule.performApiRequest(request, function (response) {
    if (cb) {
      handleAPIResponse(response, cb);
    }
  });
};

var getSnapshots = function (symbols, cb) {
  var request = global.RemoteApiRequest.create();
  request.endpoint = 'get_snapshots';
  request.parameters = { symbols: symbols };
  script.remoteServiceModule.performApiRequest(request, function (response) {
    if (cb) {
      handleAPIResponse(response, cb);
    }
  });
};

getSnapshot(script.ticker, function (err, parsedBody) {
  if (err) {
    print('ERROR: API did not return correctly');
  } else {
    print(JSON.stringify(parsedBody));
    // Read about the parsed bodys data here https://alpaca.markets/docs/api-documentation/api-v2/market-data/alpaca-data-api-v2/historical/#snapshot---ticker
  }
});
-
Drag the JavaScript asset to the
Scene Paneland set the Remote Service Module input with Alpaca module. -
Check
Loggerpanel for the output.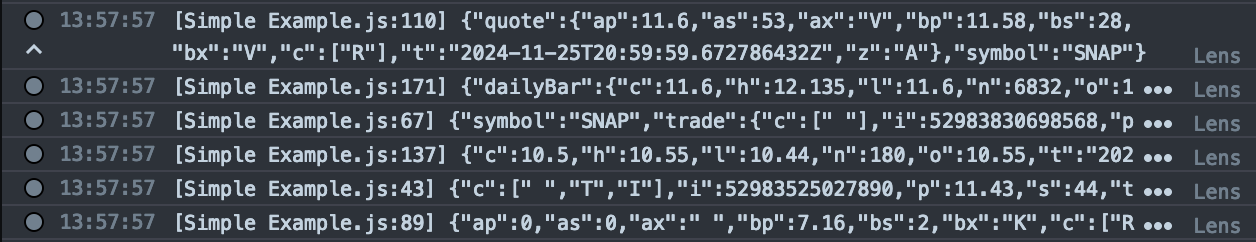
Example Walkthrough
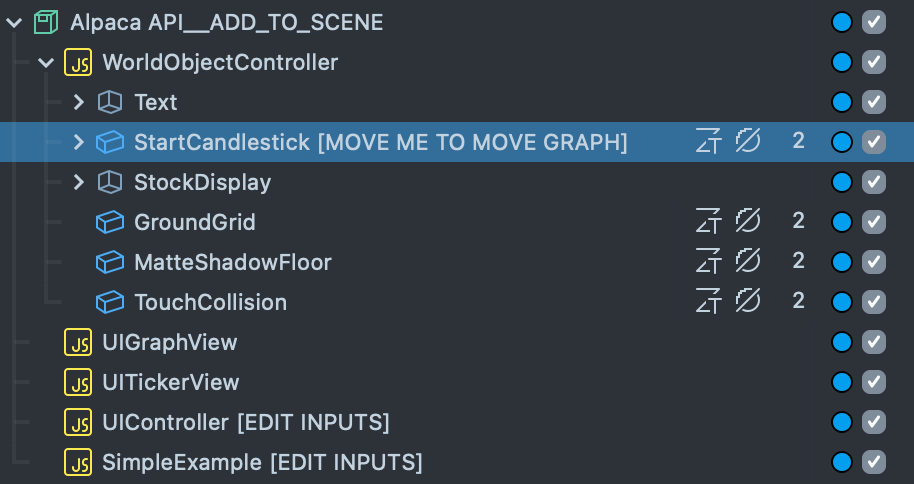
The Stock Market - Alpaca API Example asset is available in the Lens Studio Asset Library. Import the asset to your project and place the prefab in the Scene Hierarchy.
The Stock Market - Alpaca API example demonstrates how to use Remote Service Module to obtain price and historical information about various stocks using the Alpaca API. This guide will show you how to use this example to create historical price graphs as well as to use the API to create new visualizations of your own.
You can read about all the functionality available in the Alpaca API here
This example has two main components: A UIController and associated Views. The controller fetches data about a specified stock ticker and then populates the views. This guide comes with two example views you can use. A UIGraphView that is used to draw a candlestick graph of the historical price data for the stock, and a UITickerView that displays the price and ticker name of the stock.
UIController
The UI controller is responsible for calling the Alpaca API, parsing the results, and giving them to Views to be displayed as a UI.
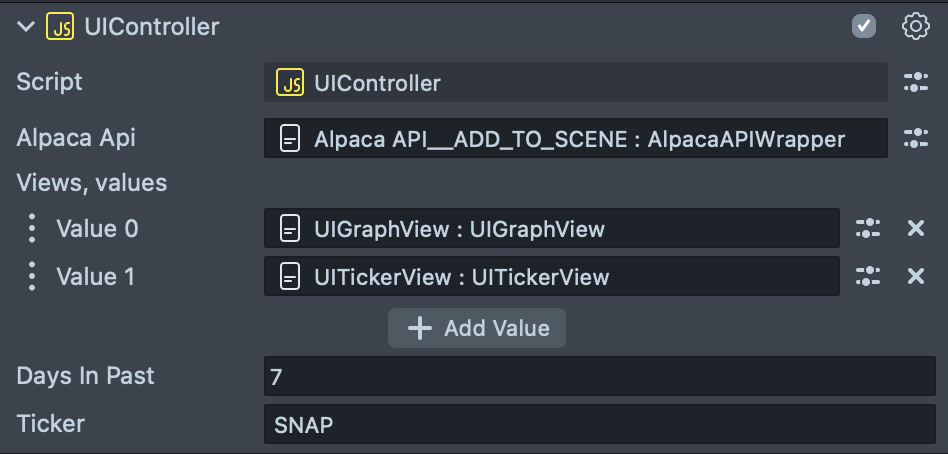
- Alpaca API: The Alpaca API script component that the controller can use to make calls to the Alpaca API.
- Views: An array of views that the controller can update with returned information from the Alpaca API.
- Days in Past: The amount of days in the past to query historical data. The controller will query data from this many days ago to the current day.
- Ticker: The stock ticker to obtain data for.
Try changing the Ticker and Days in Past field to create your own custom stock market lens!
Views
The scene has two views by default - UIGraphView, which renders a graph of the stock price, as well as UITickerView which shows the ticker name as well as the latest price of the stock. A view can implement several functions that the controller can call to display relevant information.
A view can expose the following functions via its script.api property for a controller to call.
- setTicker: (ticker) Called to set the specified input ticker on the view
- setBars: (bars) Sets the historical price data for the last specified input days
- setTickerPrice: (price) Sets the last traded price of the specified ticker
Both the included views use some of these functions to display information.
You can create your own views to display information about a stock of choice! Simply create a script component that exposes any of the above functions and add it to the list of views in the DisplayController.
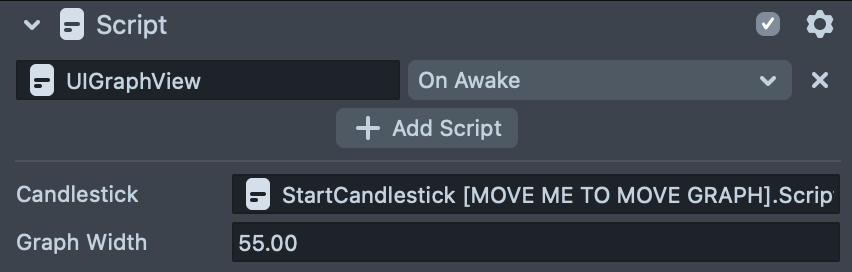
UIGraphView
The UI graph view can be used to display a candlestick graph of the historical price data for a stock in the past N days. A candlestick graph is composed of a set of UIGraphCandlestick’s each which displays the high, low open and close price for a slice of time in between the beginning and end of the range specified in the UIController. A properly configured graph is already included in the scene and its position is controlled by the StartCandlestick object. Simply move this object to change the position of the graph.
If you wish to change the size of the graph, you can do so by altering the graph width input to the UIGraphView.
All financial data is provided by Alpaca for informational purposes only, and is not intended for trading or investing purposes.
Previewing Your Lens
You’re now ready to preview your Lens! To preview your Lens in Snapchat, follow the Pairing to Snapchat guide.