Lens Profiler and Trace Analysis
Ensuring good performance in your Lens is critical to creating a good end user experience. As you add more capabilities into your Lenses, you should be aware of its impact on how the Lens can perform. Every object, texture, script, cameras, ML model, etc. you add to your Lens can affect its performance.
The Lens Profiler panel allows you to take a deep dive into what is happening in your Lens down to the microsecond. You can see your Lens Activation Time, as well as what’s happening every frame.
If you’re not passing Lens testing during submission due to high Lens Activation Time and/or low FPS, use the Lens Profiler to identify what is slowing down your Lens!
Creating a Trace
In order to create a trace, you will need to use a device.
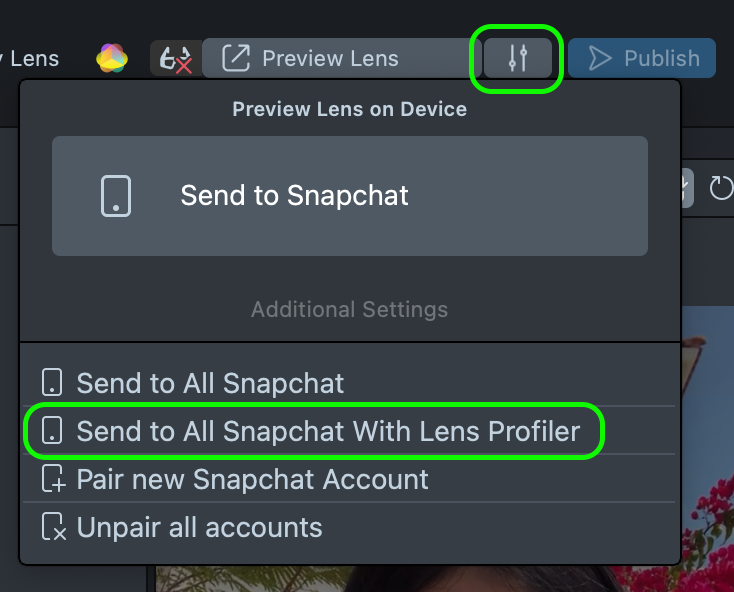
You can start a trace by pressing the Additional Settings button next to Preview Lens and selecting Send to All Snapchat with Lens Profiler.
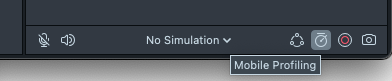
When activated, you will see a red rotating semi-circle around the Mobile Profiling icon at the bottom right of your Preview panel.
On your device, use the Lens as you’d expect the users to.
When you’re finished, you can stop recording the trace by pressing the Mobile Profiling button.
![]()
You will then see your system dialog box prompting you to save your trace. Make sure to save it so you can see the result!
Opening the Trace
The trace that you record is the open-source Perfetto trace analysis, which is not unique to Lens Studio. You can open your traces in other softwares too!
When you save your trace, it will automatically be displayed in a web browser through the Perfetto tool.
You can also go to http://ui.perfetto.dev to open the traces you've saved without opening Lens Studio.
If profiling is still having issues, try restarting Lens Studio, or re-pairing your Snapchat account.
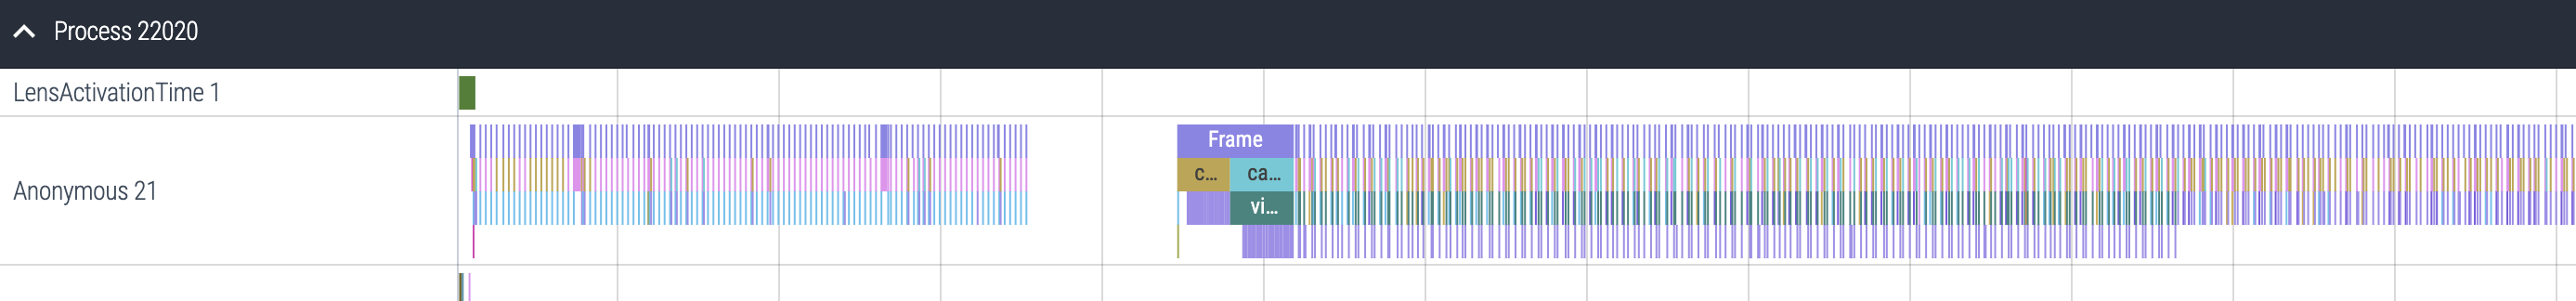
Lastly, press the Process header to see the details of your Lens.
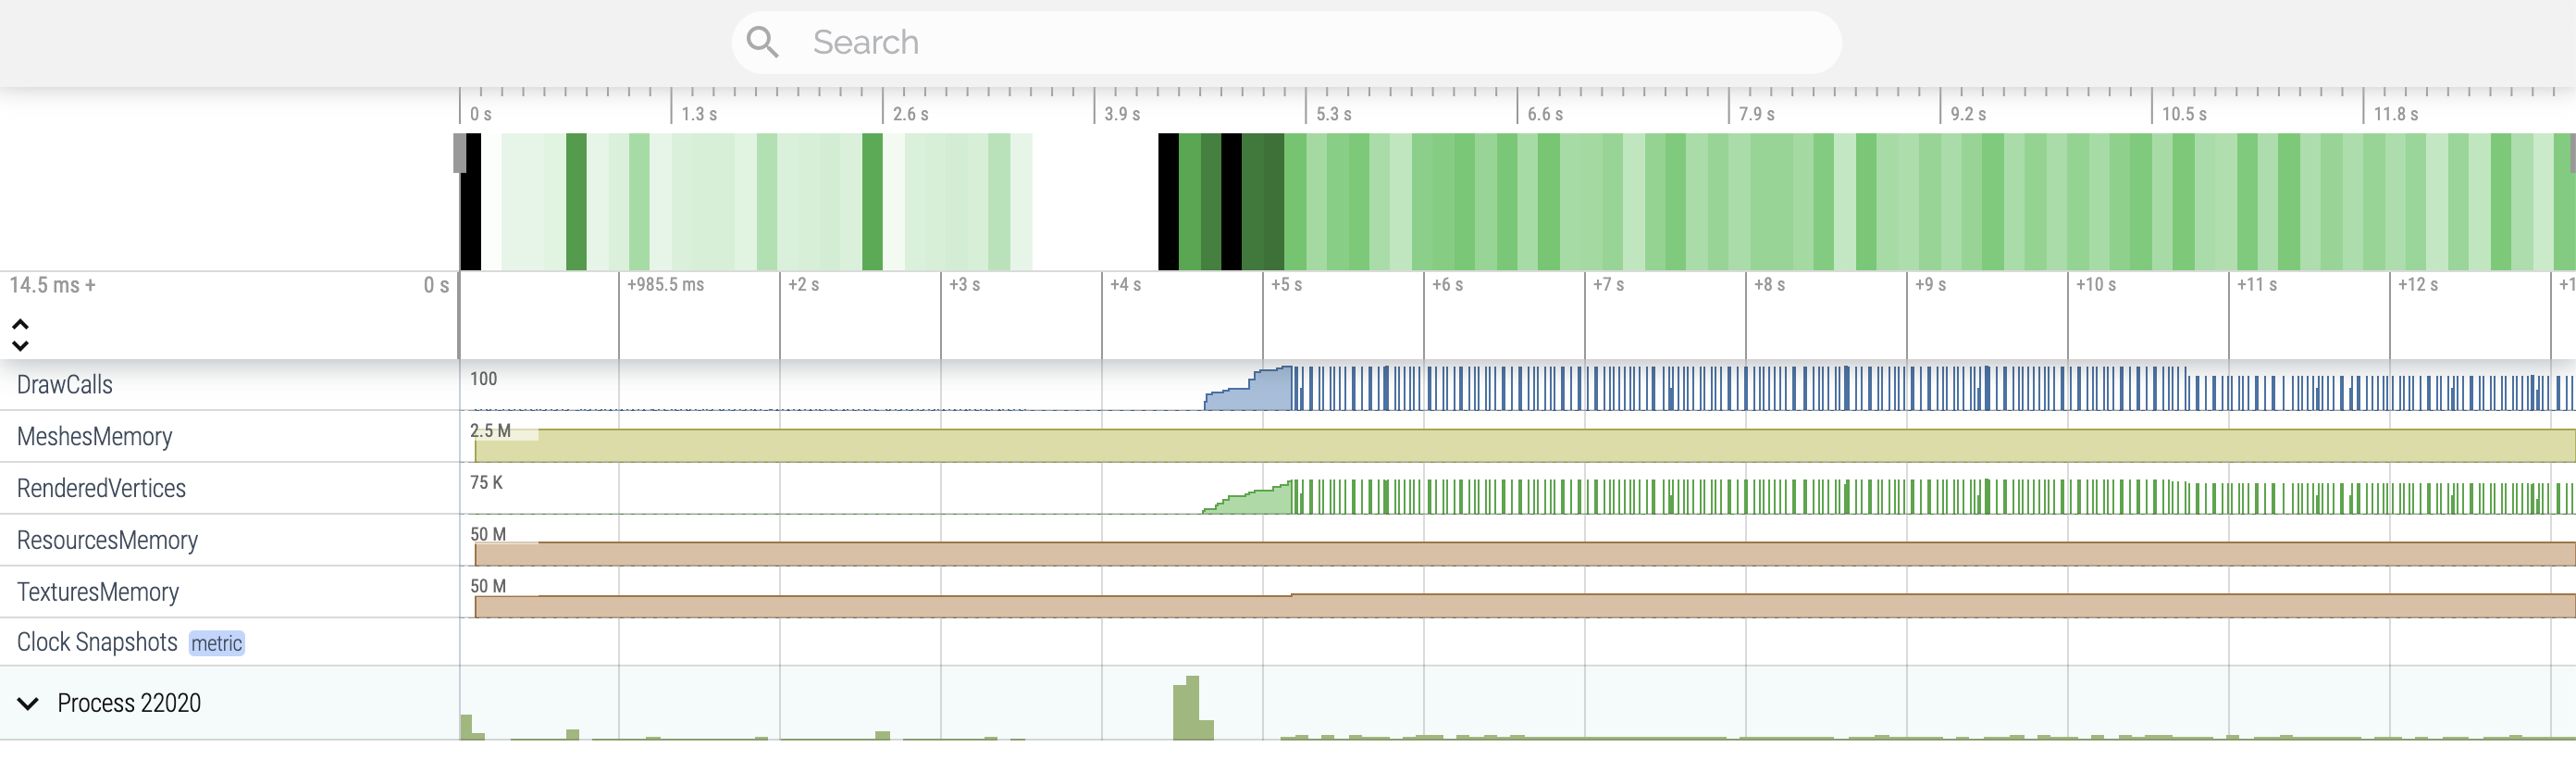
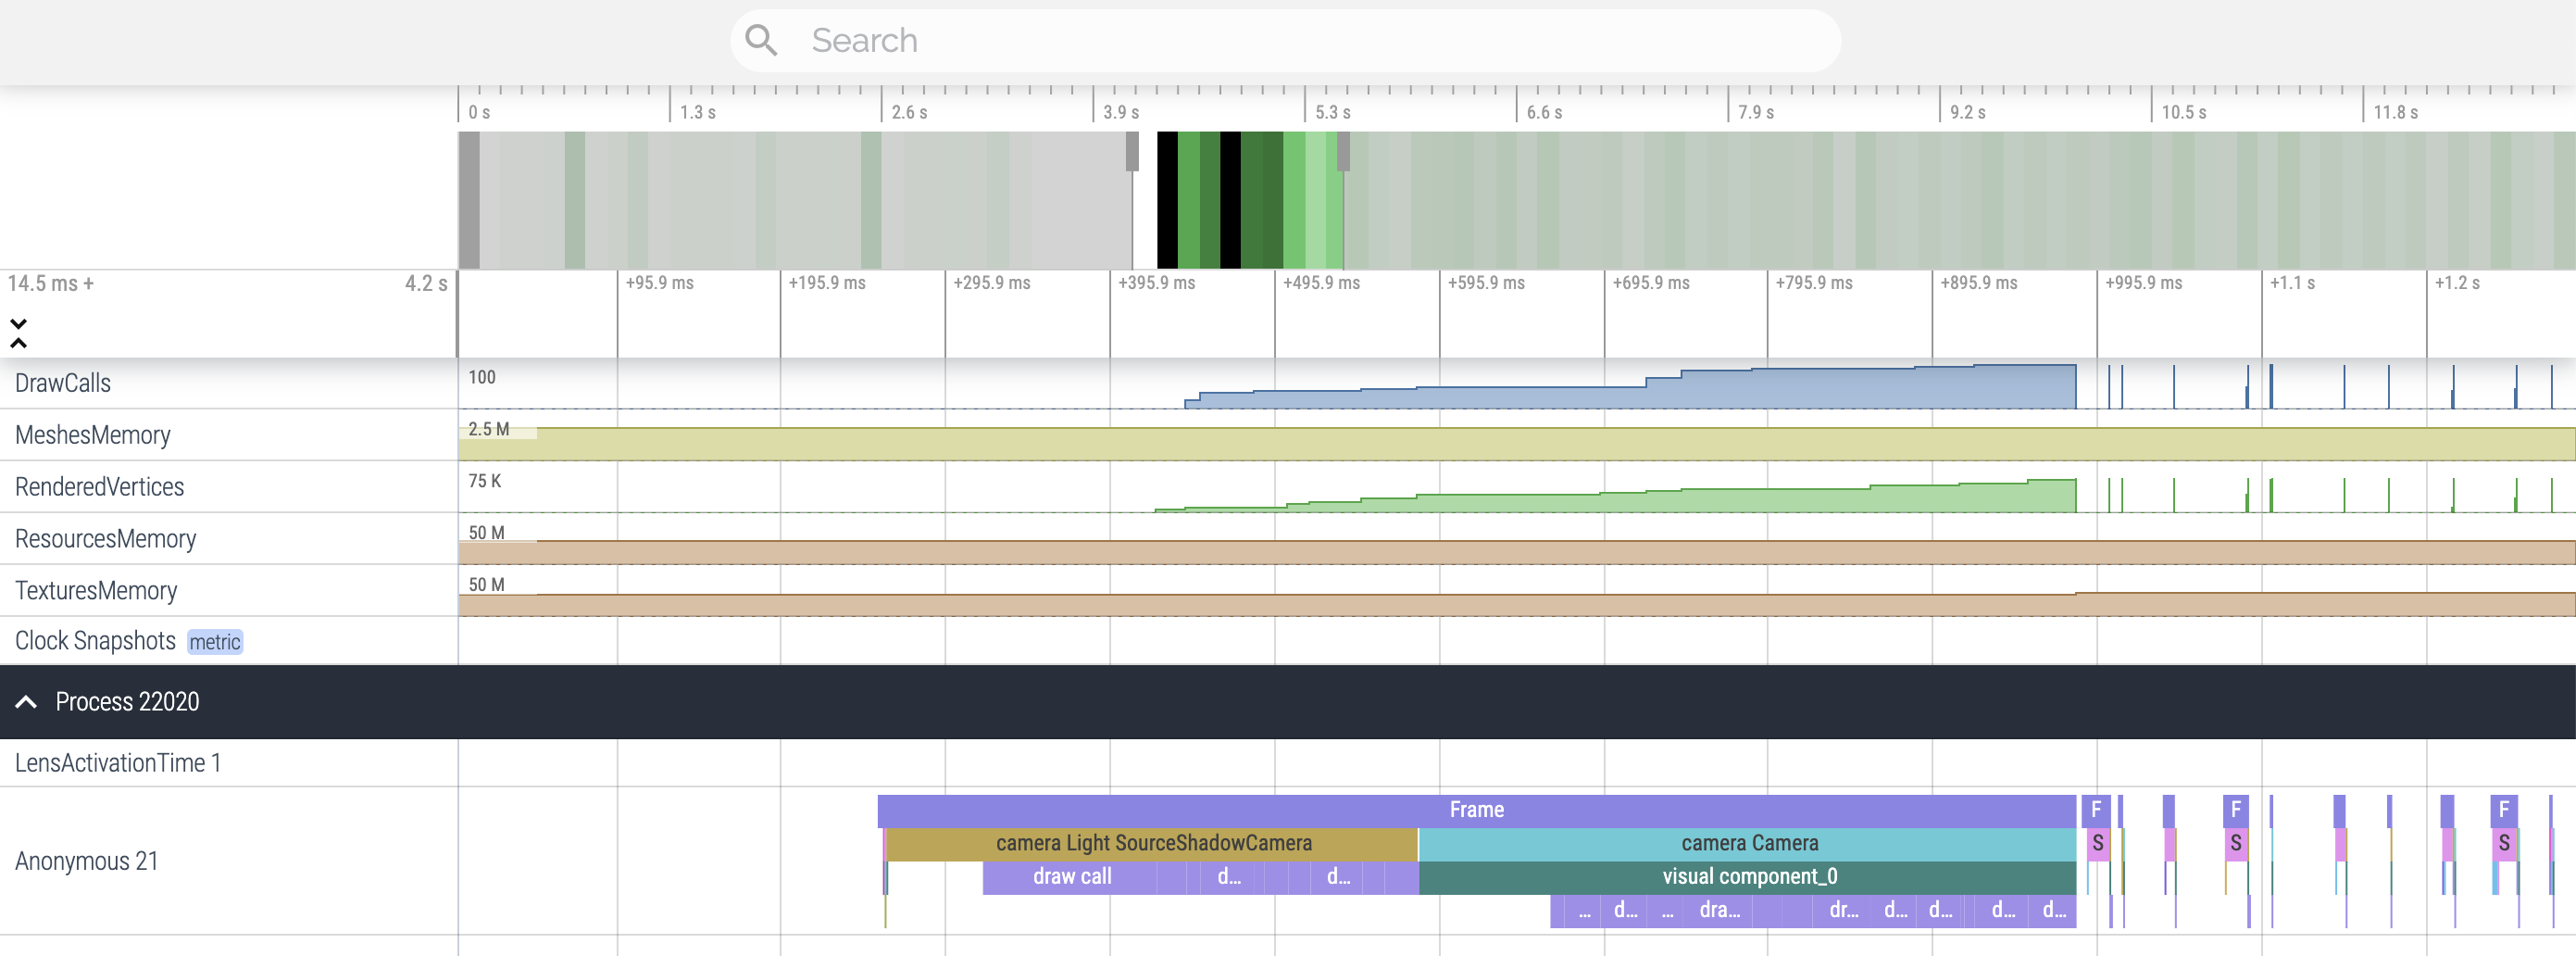
Navigating the Lens Profiler
You can navigate your trace with your keyboard or with your mouse.
WandSwill zoom in and out.AandDwill pan left and right.
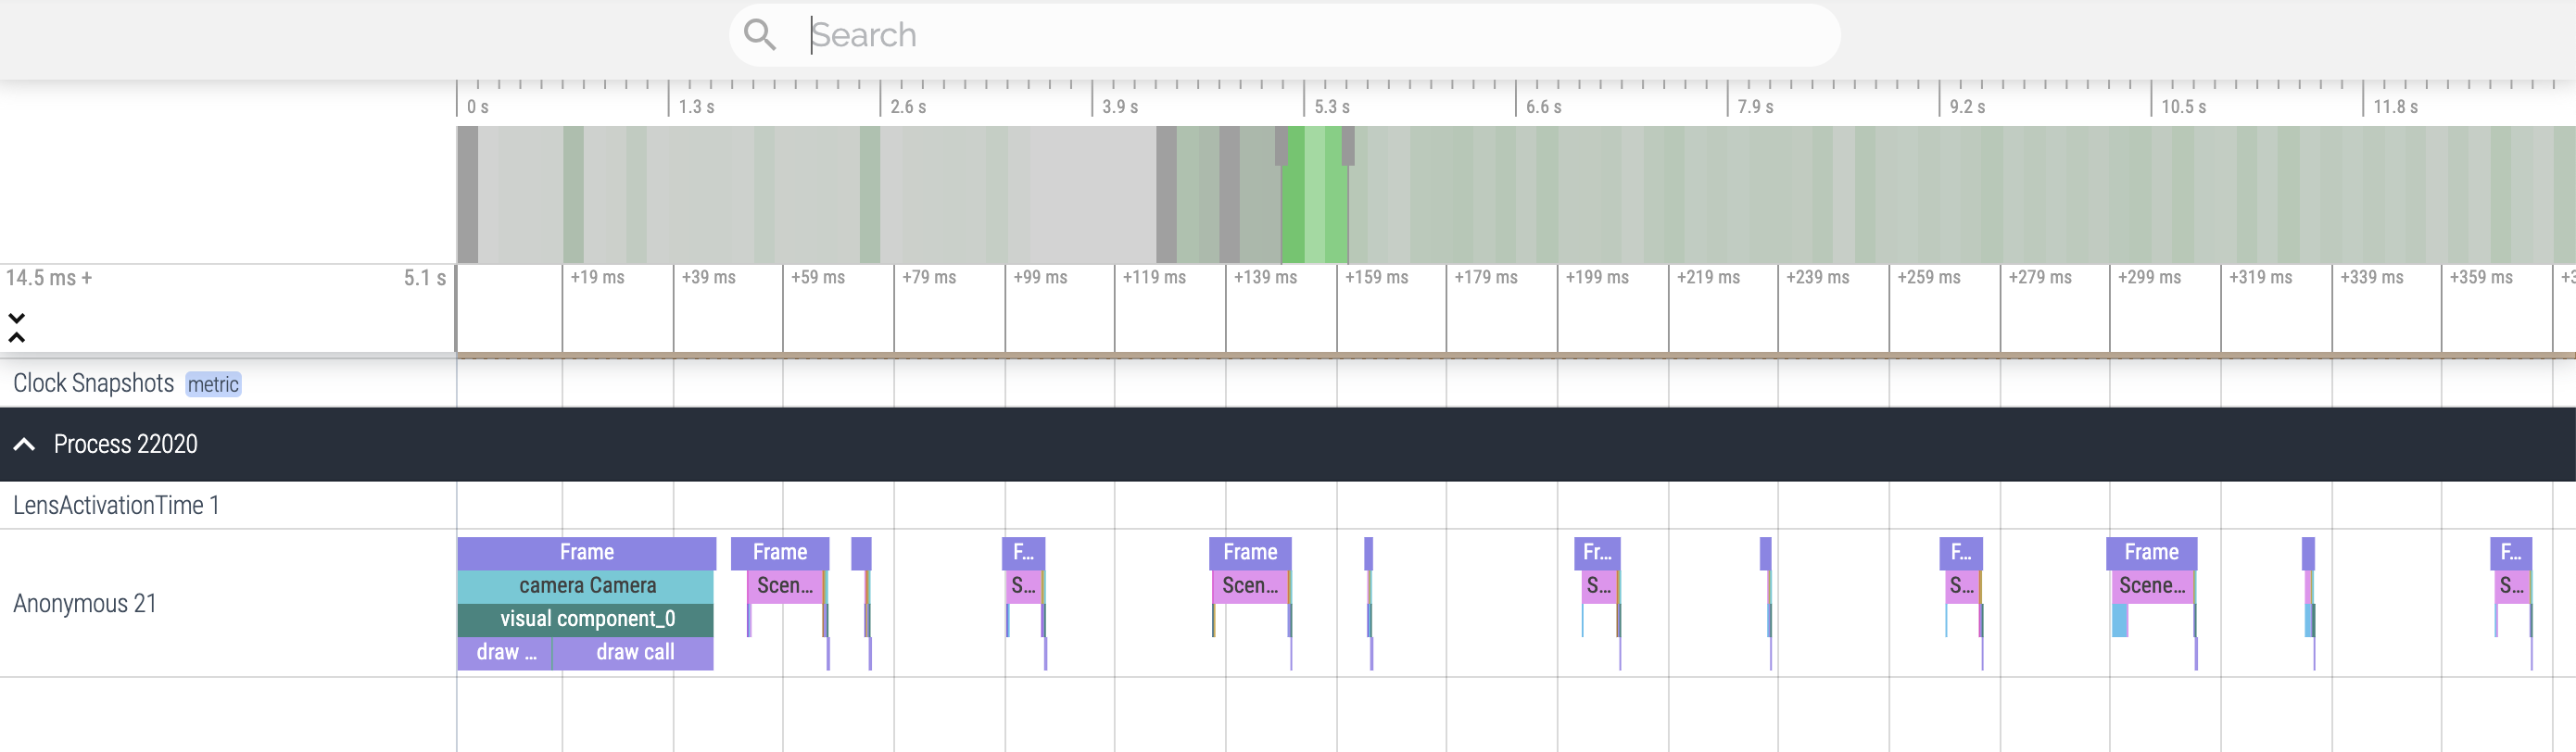
For example, we can zoom in to the first draw call of the Lens. Notice how the top timelien bar has a segment highlighted which shows you where you're currently profiling.
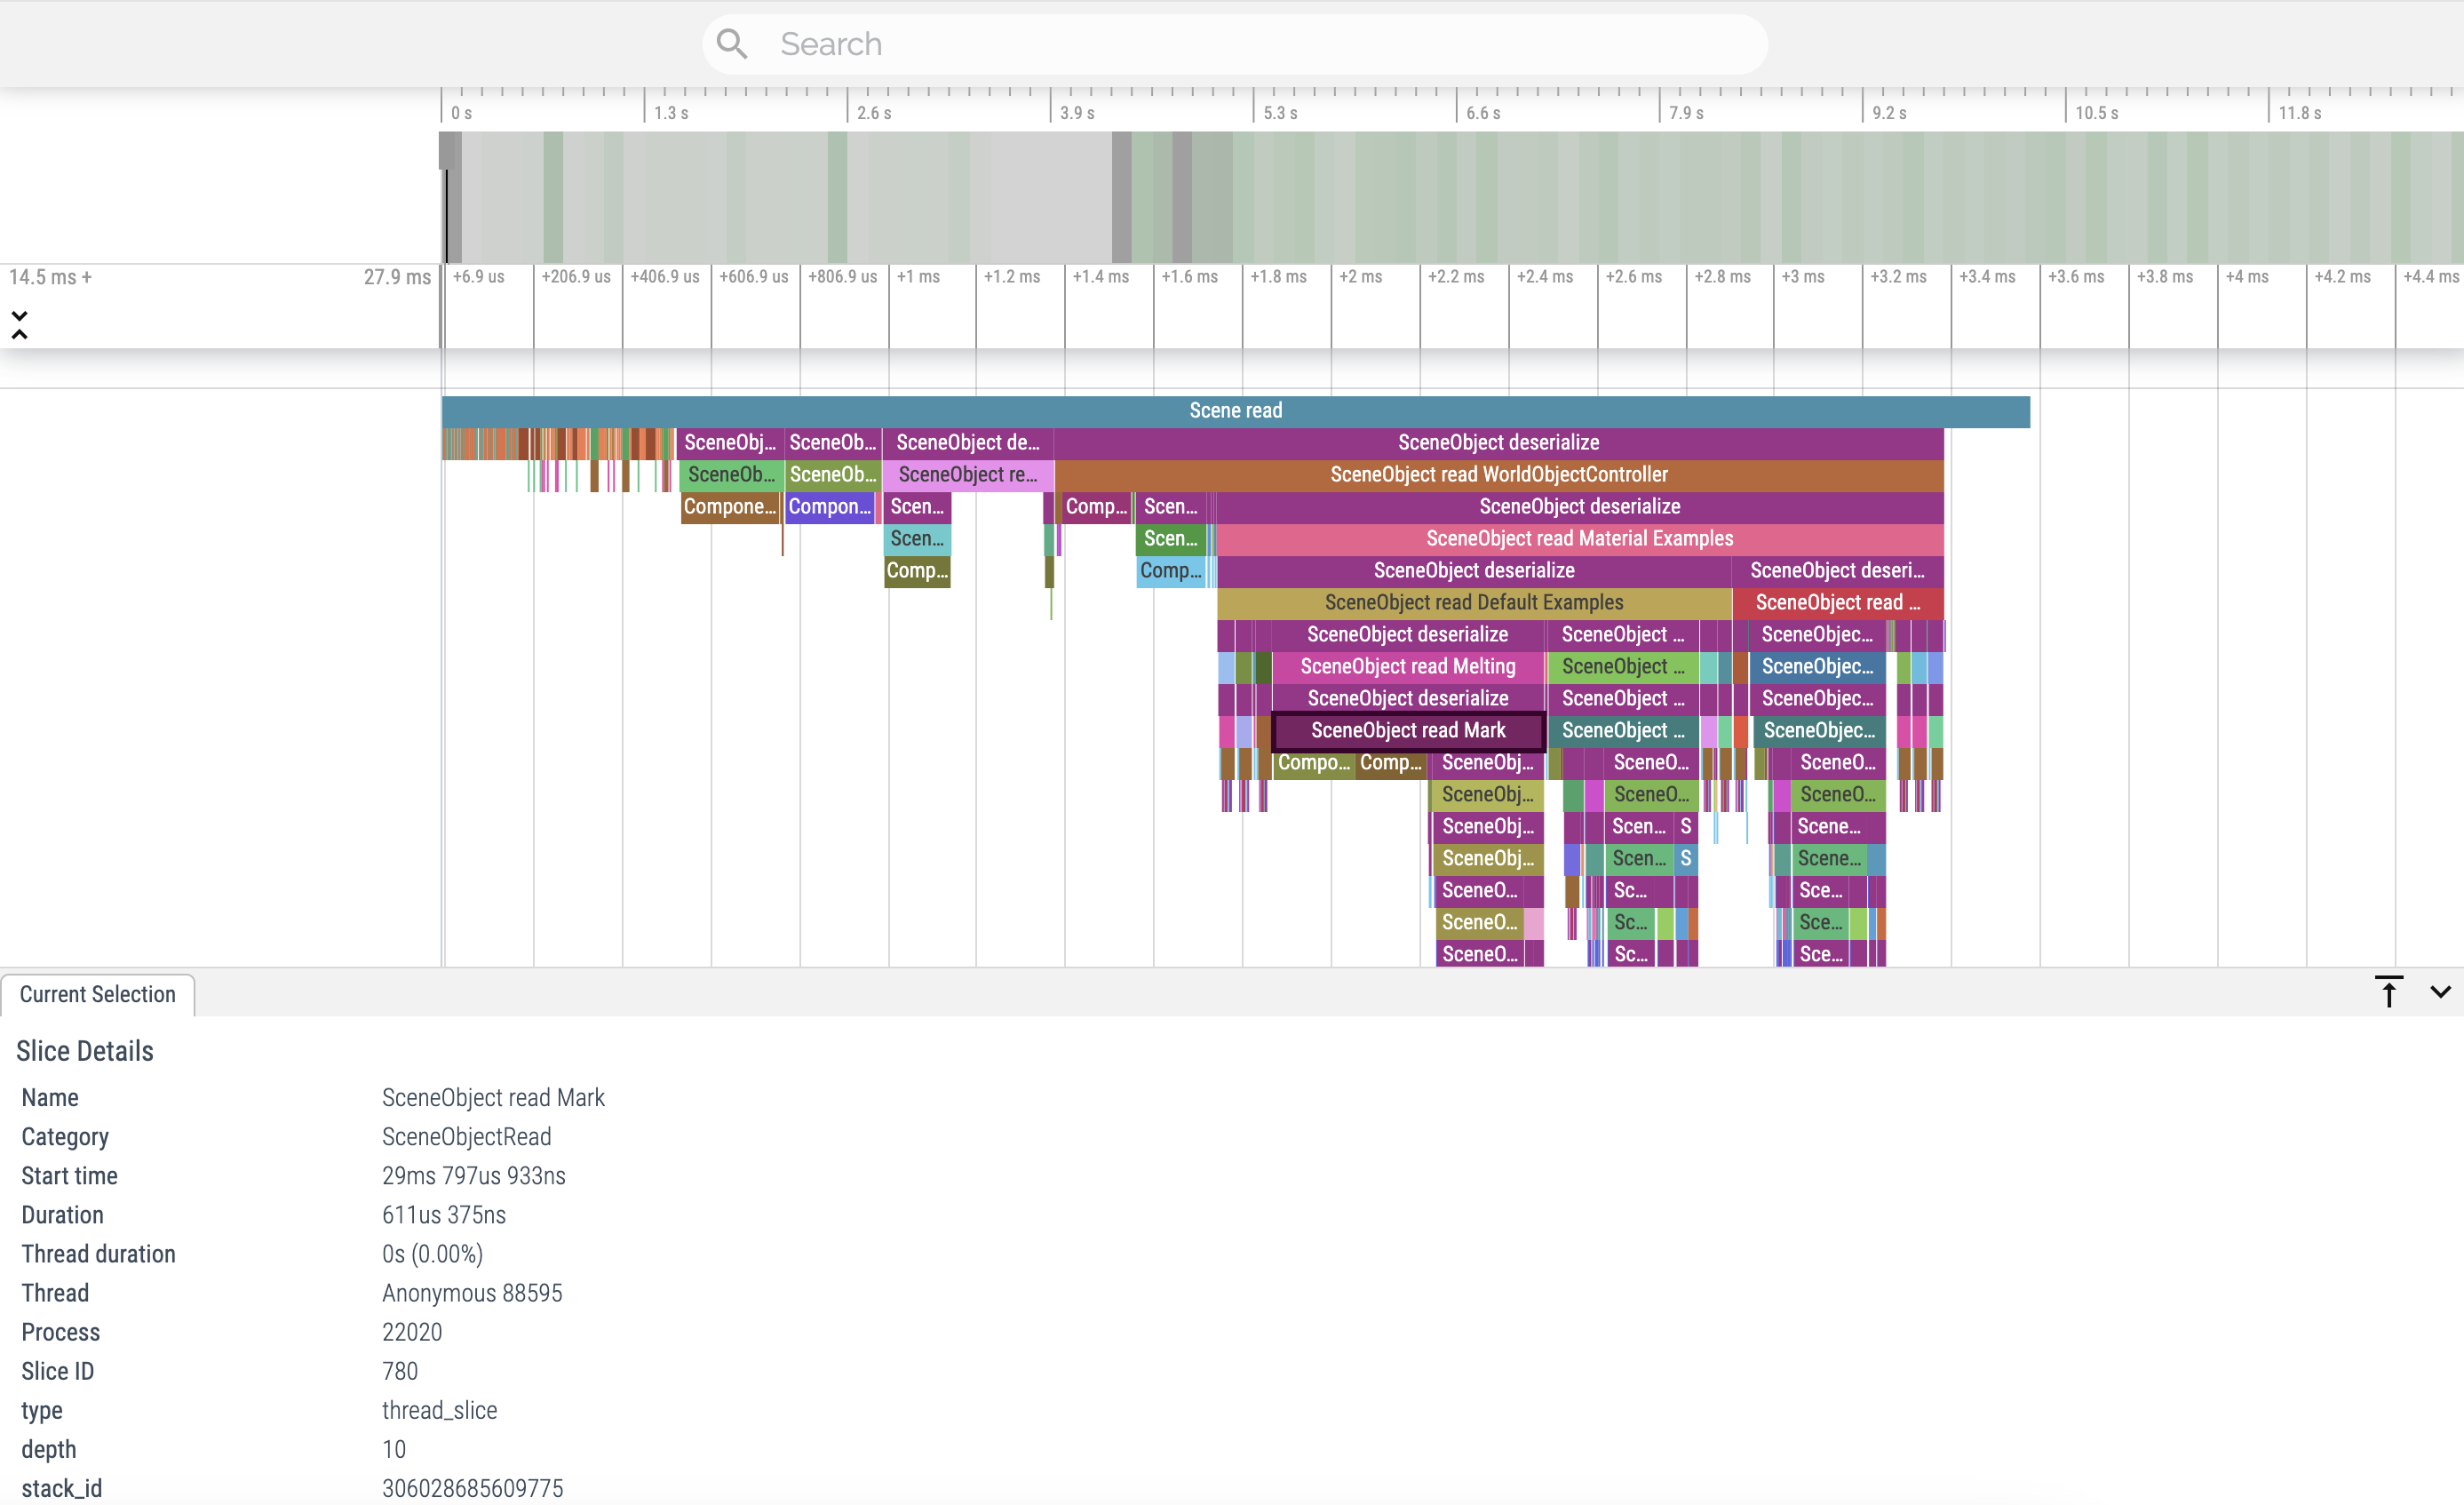
Looking at Slices
After zooming in to the area of interest, you can select any slice to see more information about the slice.
These metrics include:
- Name: the type and name of the slice
- Start Time: at what point during the lens did the slice occur
- Duration: the total time, including all the slices underneath.
At this time there is no way to pick colors for your scopes.
You can click and drag to select multiple slices
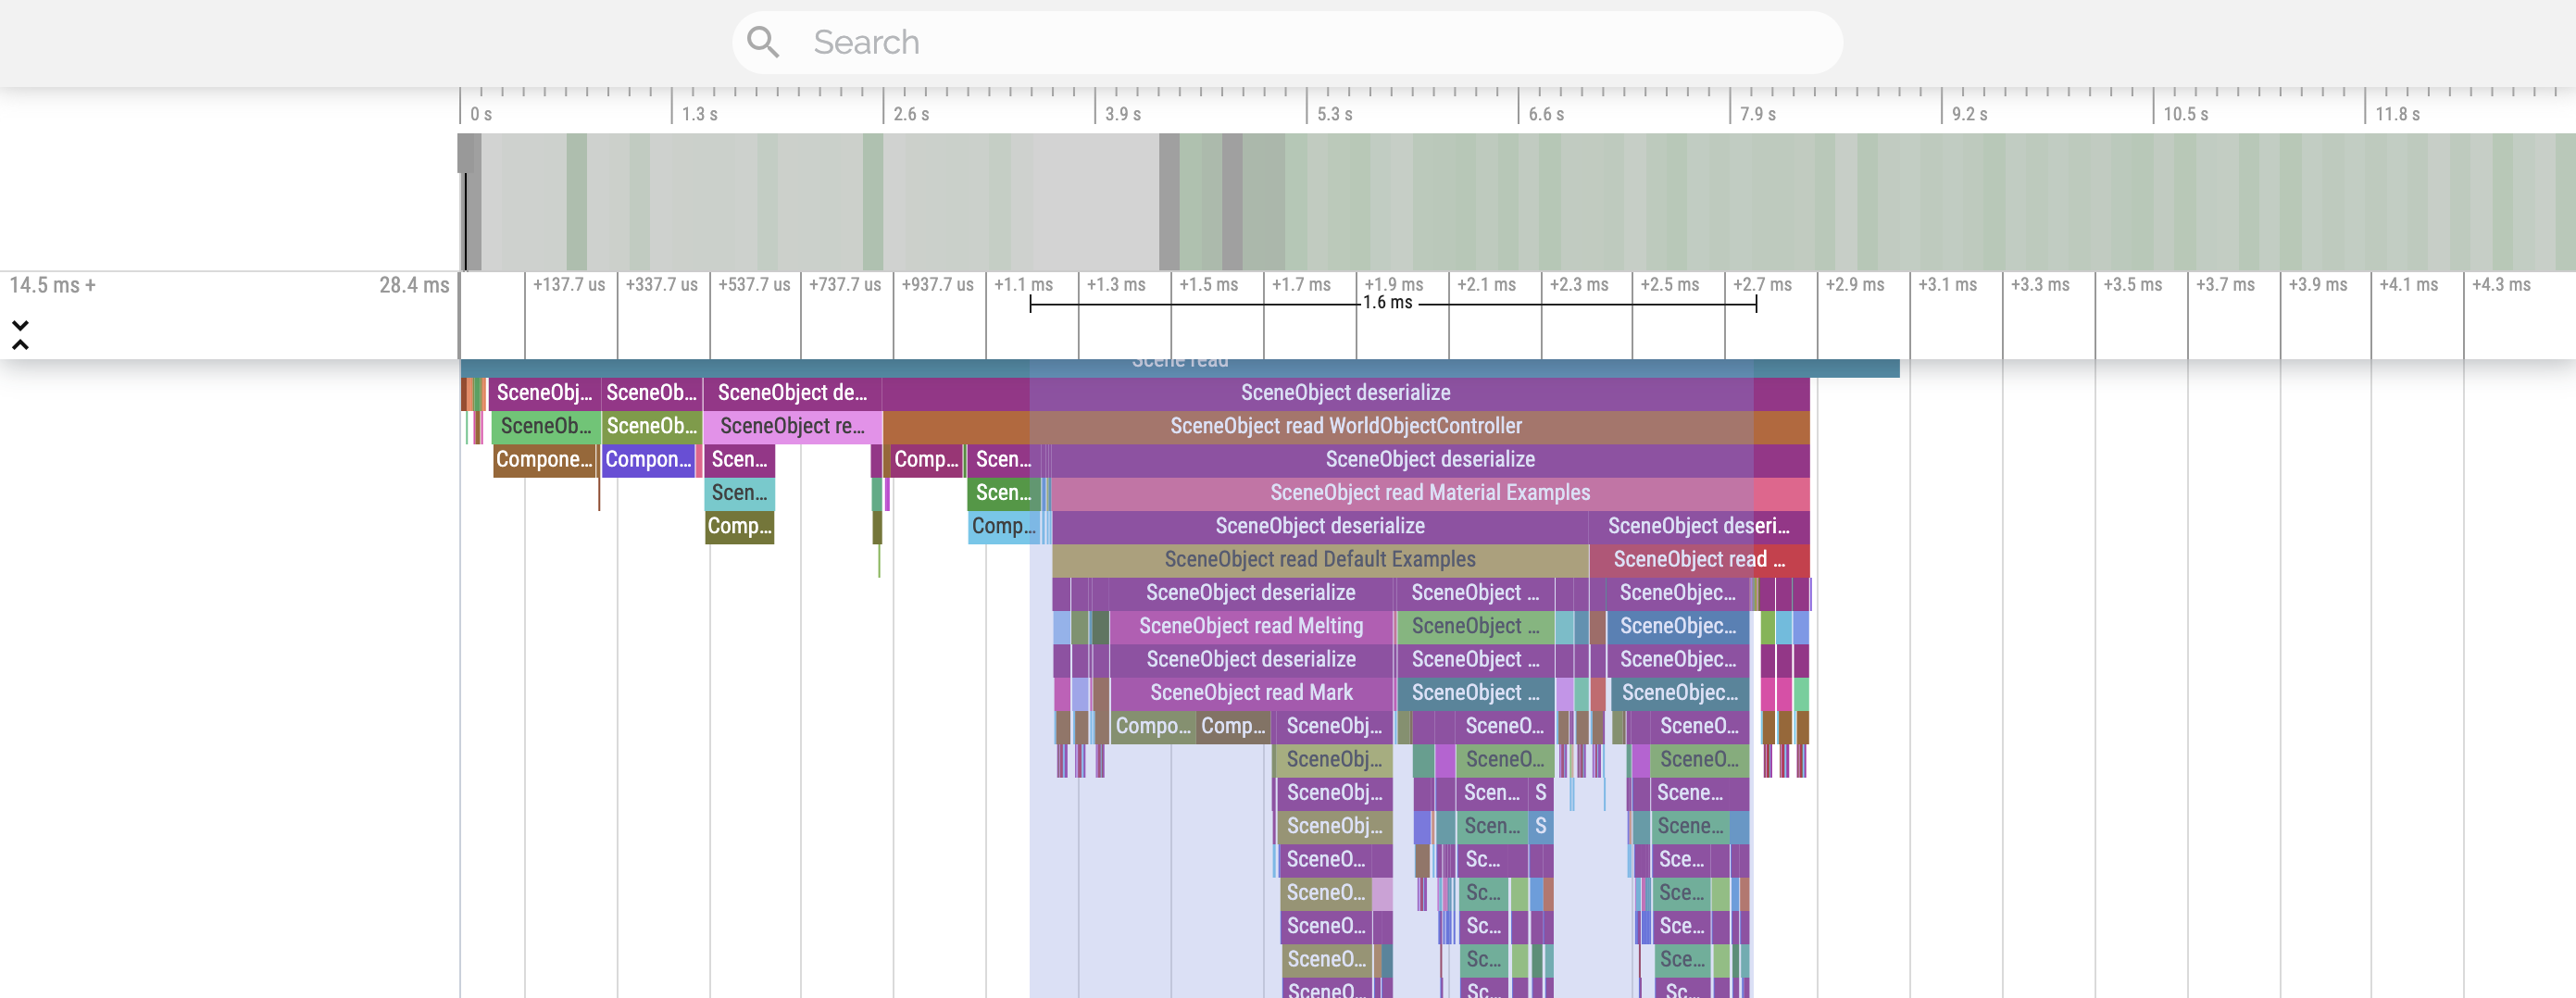
When selecting multiple slices, you will see high level metric for each slice. Additionally, you will also see
- Wall Duration: the total time, including all the slices underneath. Whereas,
- Self time: the amount of time for this specific call, not accounting for the boxes underneath.
- Occurrences is the amount of time a slice of this type has been called.
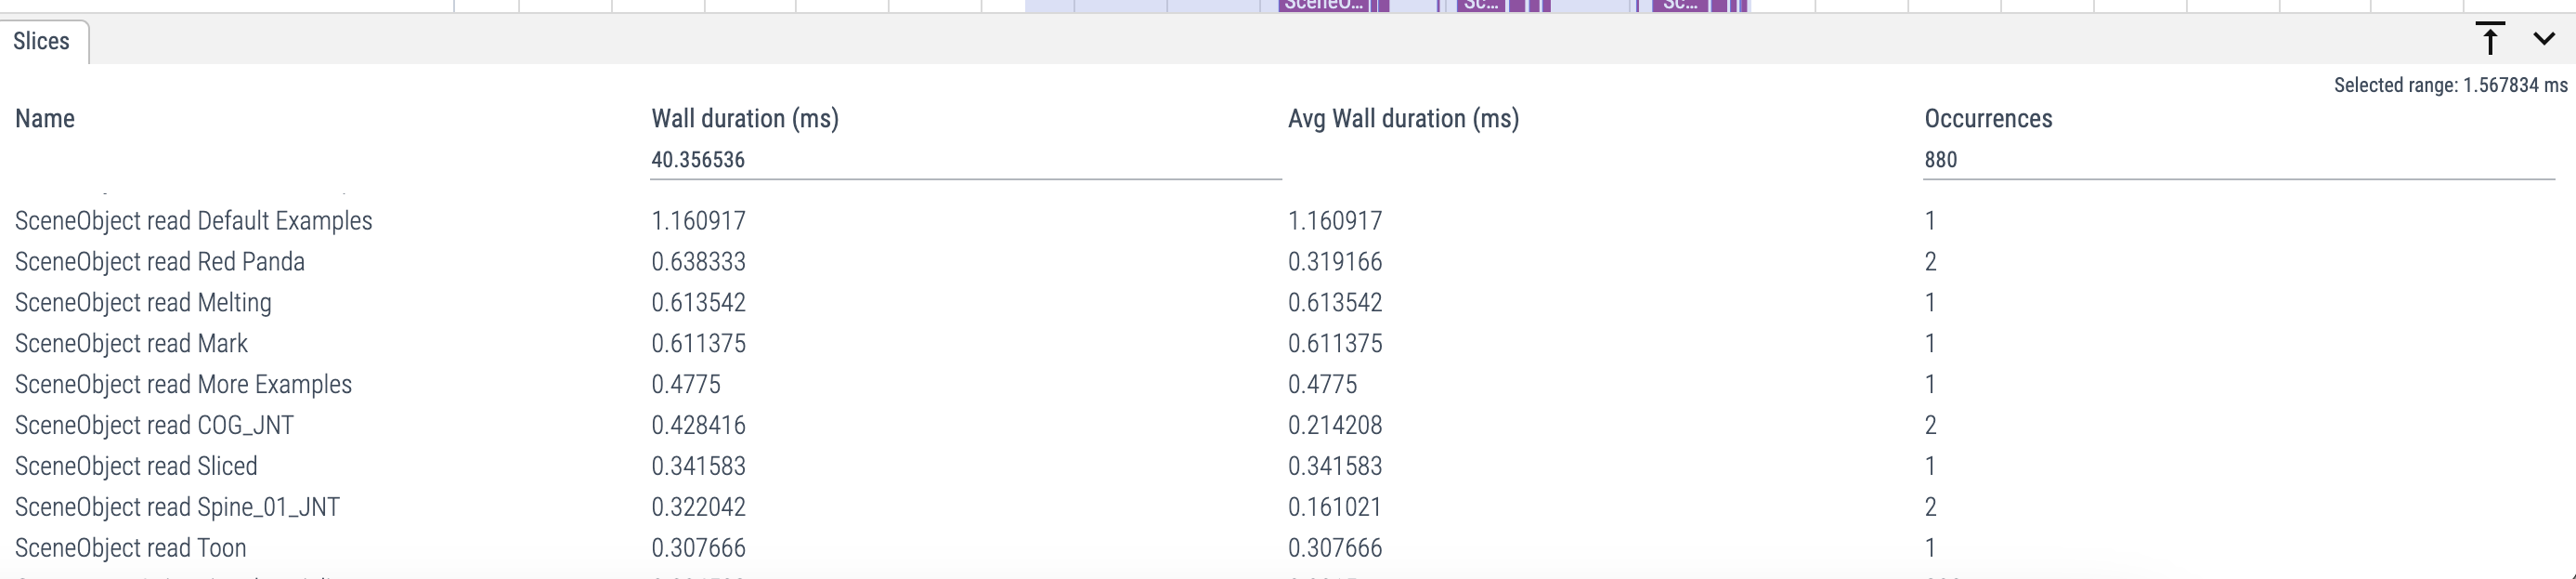
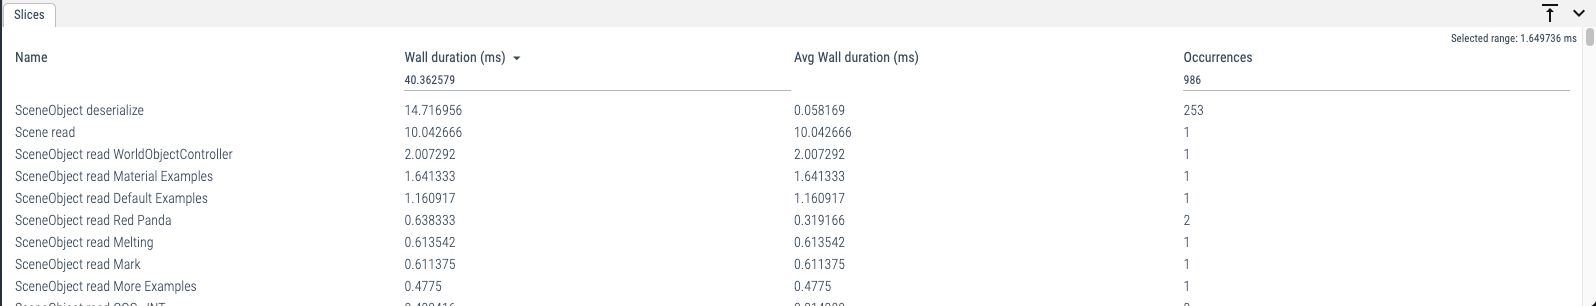
You can sort the selected slices based on what you are most interested in. For example, we can take a look at which slices took the most Wall Duration. To do this, click on the column title in the slices list in the bottom half of the panel.
In this example, during this portion of the Lens Start Up, there are 253 occurrences of deserialization, which is taking up the most amount of time.
This is why, when possible, you should delete any objects that you don’t need! As even if you’re not using it, your Lens will still need to load it.
If you need the object, but not all the time, consider using Asynchronous Prefab and Scene Manager to load them only when you need them.
Looking deeper, we can see in our selected scope that we're loading Scene Object read Melting which represents the Melting object in the Scene hierarchy panel.
| Scene Hierarchy Panel | Lens Profiler panel |
|---|---|
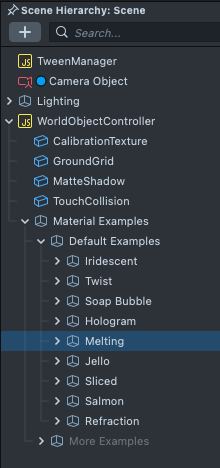 |
You can search for specific items in the search box at the top of the panel. Notice here, if you look for a disabled object it still affects LensActivationTime.
| Scene Hierarchy Panel | Lens Profiler panel |
|---|---|
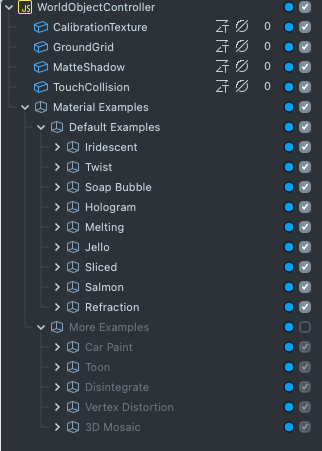 | 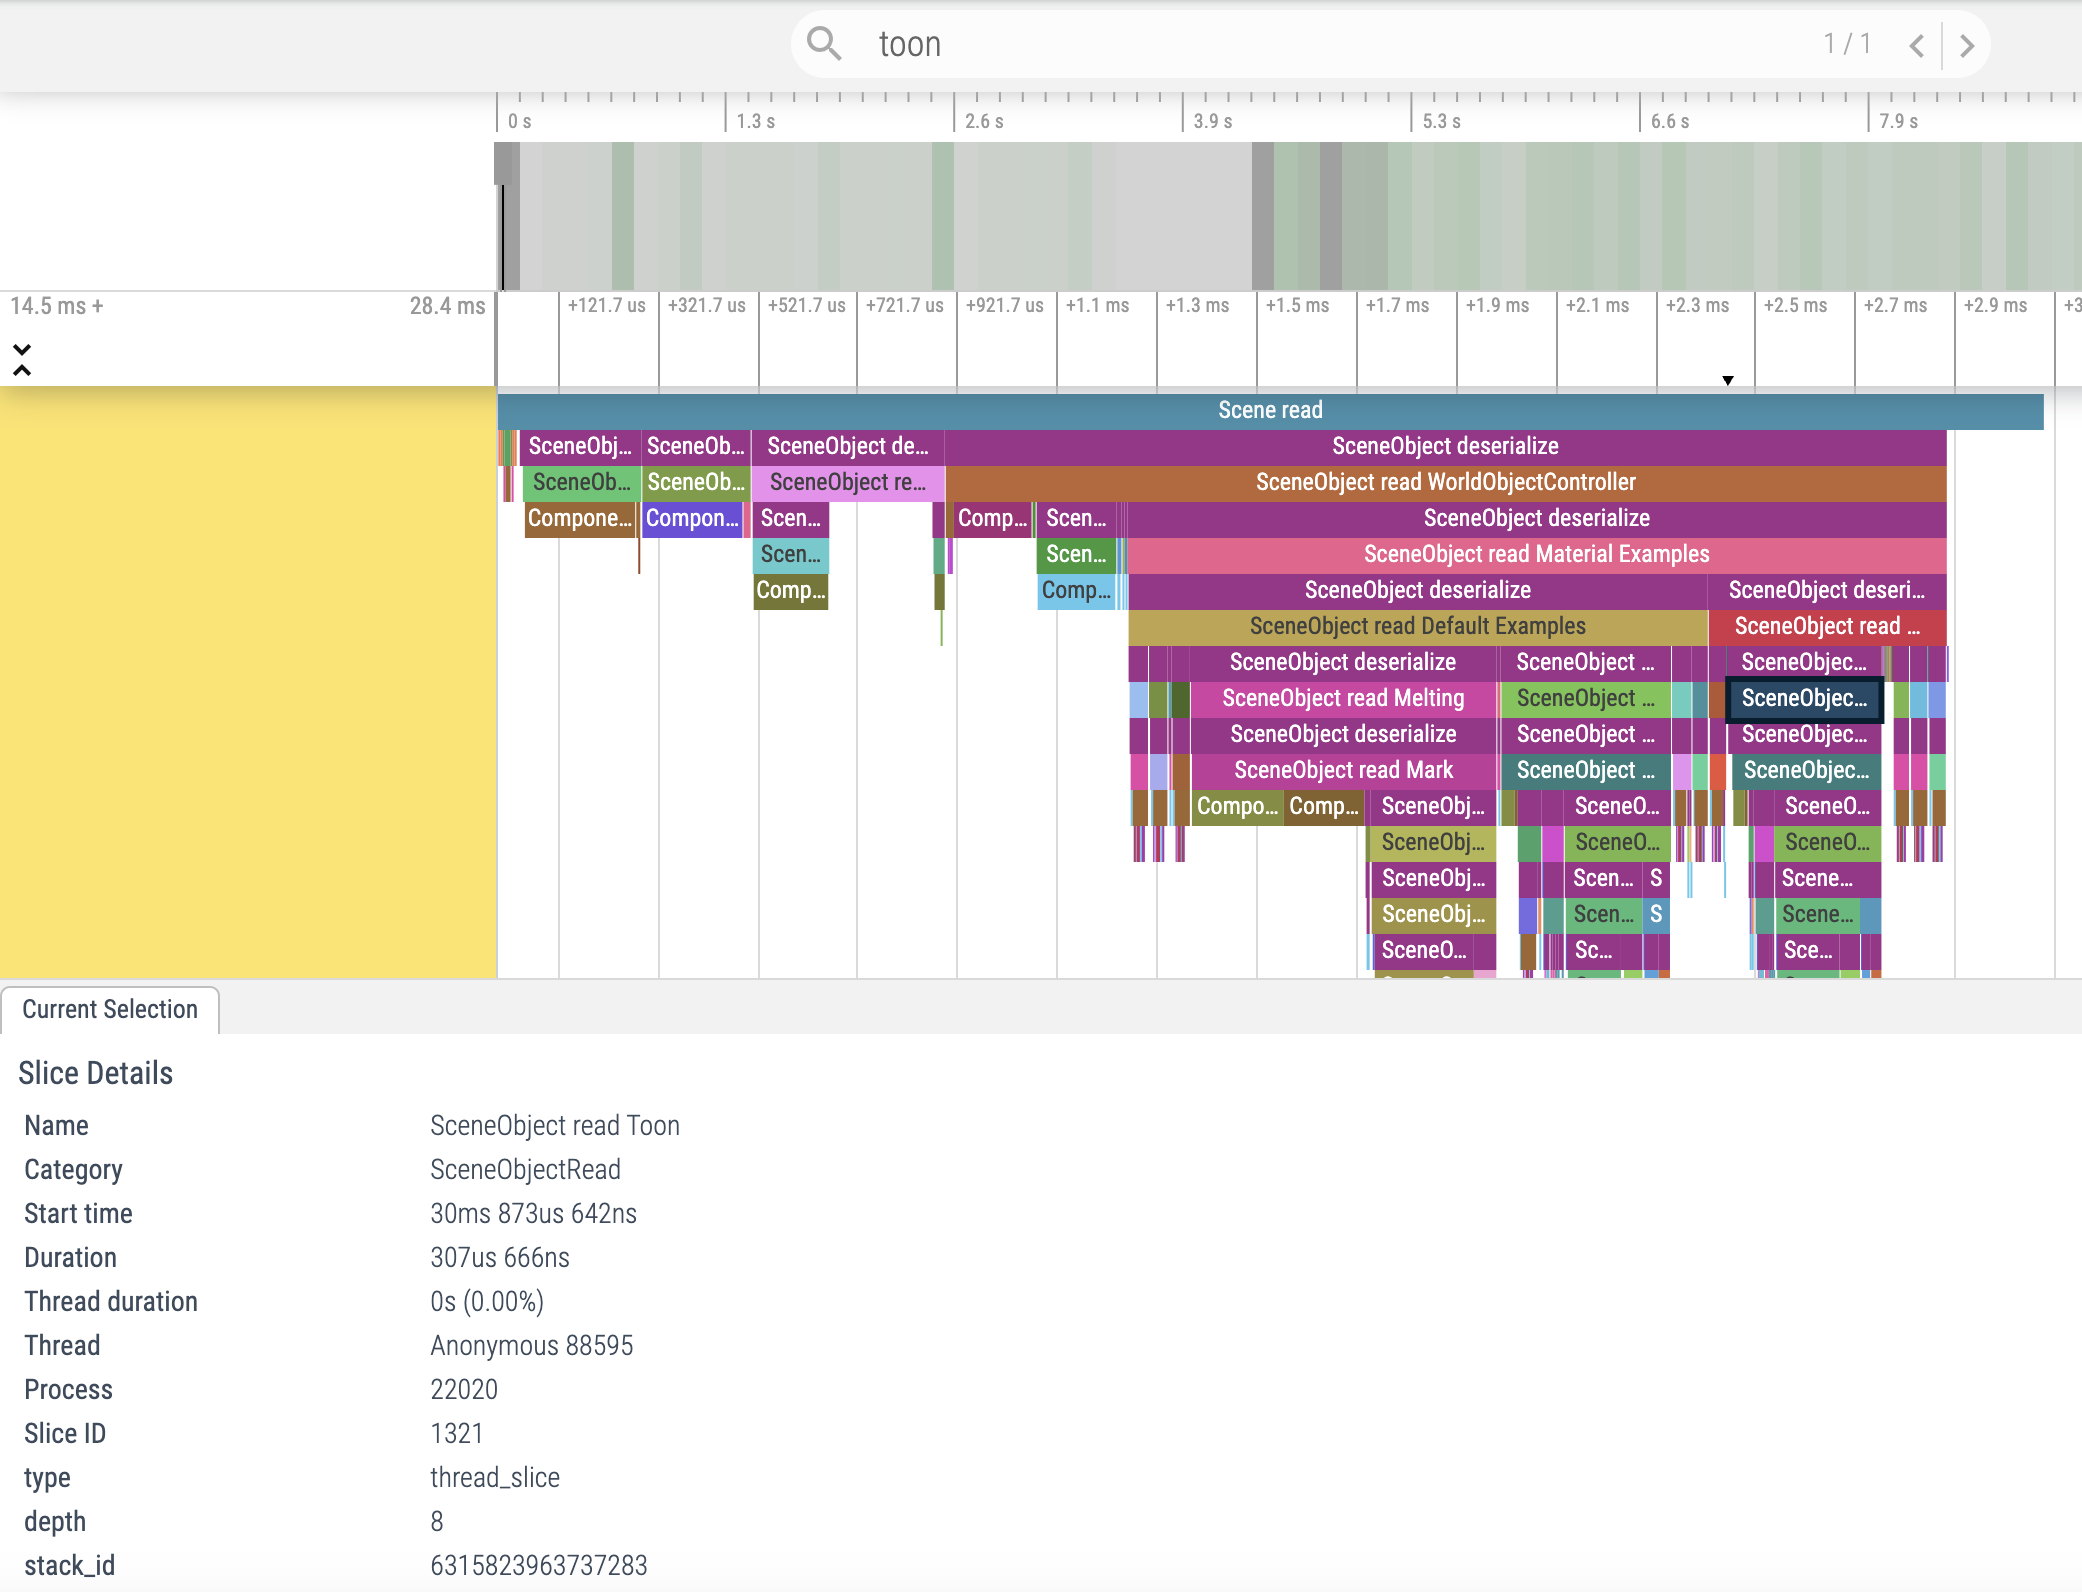 |
This LensActivationTime may differ from what you will see on Lens Submission, since this trace runs on your specific device, whereas My Lenses will test across several devices.
Once your Lens has activated, the Lens Profiler will continue recording what is happening every frame. If you need to improve your Lens FPS, take a look at big chunks and zoom in to identify what is causing the long frame time.
Further Reading
Take a look at the Case Study to see more examples of using the Lens Profiler.