Visual Scripting
The Visual Scripting Template showcases various ways to use visual scripting to achieve simple and advanced interactions in a Lens.
The Visual Scripting template provides several examples of using visual scripting to create interactive experiences. The Template comes with reusable graphs that you can use in your own project, as well as advanced examples that demonstrate how you can take advantage of visual scripting and regular scripting. Lastly, it demonstrates how you can connect Visual Script to Behavior, Tween, and your own custom written scripts.
To learn more about Visual Scripting take a look at the Visual Scripting guide.
Tutorial
Guide
There are 4 kinds of script graph examples in the Script Graph Template:
- Simple Examples - small graphs that demonstrates common logic
- Complex Examples - bigger graphs that demonstrates more complex logic
- Tween Examples - using Script Graphs to set up tween animations and chains.
- Behavior Examples - using Behavior script to trigger interactions in the script graph.
The examples can be found in the Objects panel under their names. Feel free to check them out by enabling specific objects under each parent by checking the checkbox next to them.
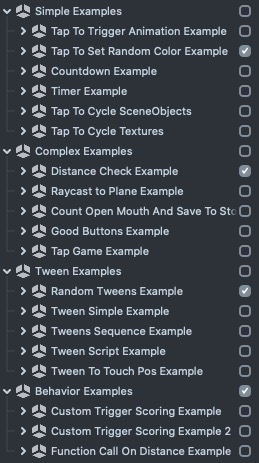
The Script Graph Editor
Each example contains an object which contains a Script component with the related Script Graphs. To see or modify the logic in each example, take a look at the corresponding Script Graphs in the Resources panel. Then, double click on it to open it up in the Script Graph Editor panel.
This guide will explore some of the examples found in this template.
Simple Example
Tap To Trigger Animation
The Tap to Trigger Animationgraph triggers an animation with specified animation layer names and loop counts as input fields from the inspector when screen is tapped.
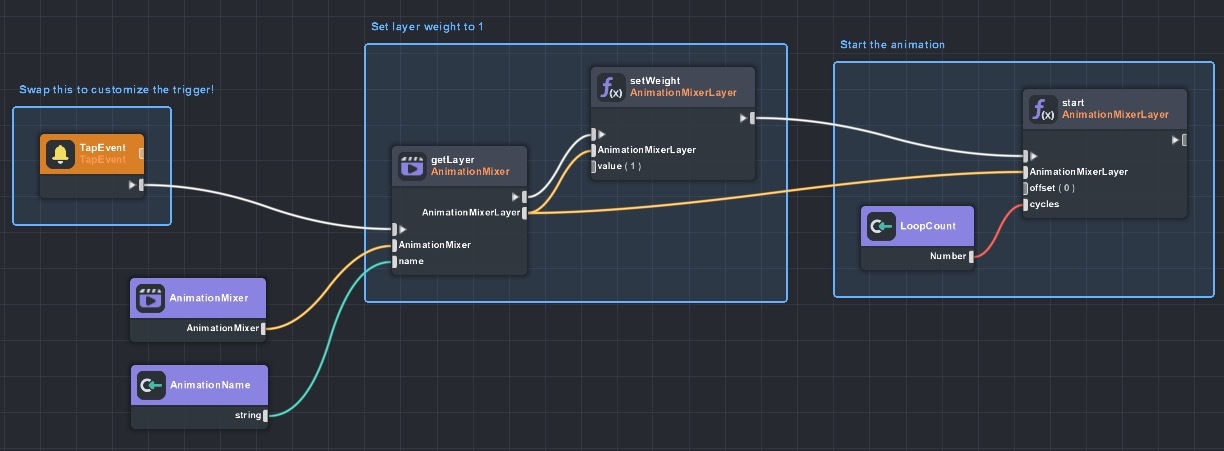
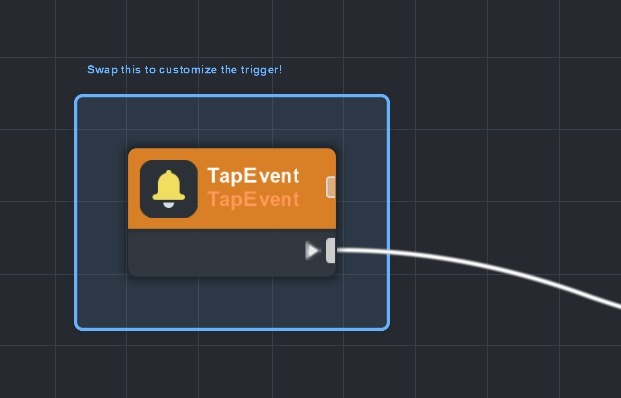
On the far left of this graph you will find the Tap Event--meaning that everything connected to this node will be called when a tap occurs. This node can be replaced by any event node such as Update, MouthOpenedEvent, or SmileStartEvent.
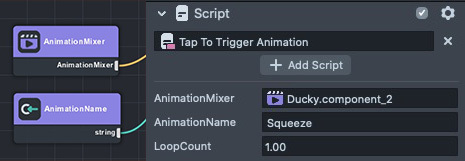
TheAnimationMixerand AnimationLayer input gets the animated object which the animation mixer is on and the specific layer name of the animation. All purple nodes represent field inputs which are links or inputs you can edit from the inspector of where the script graph is attached to.
Then in the graph we’ll use the getLayer node to get the specific layer of the animation, then the setWeight node to set its weight to 1 so the animation will be visible.
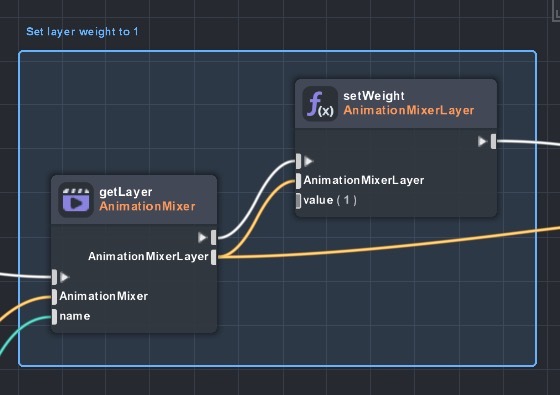
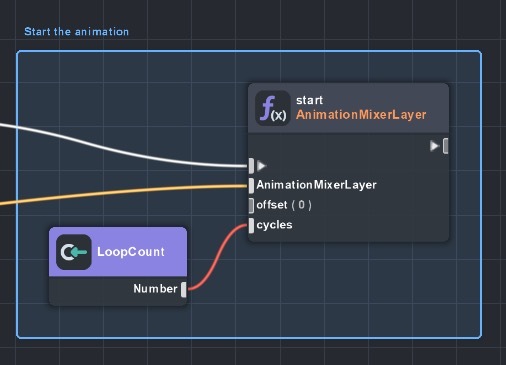
The last bit of the graph is the part that starts the animation-- the startAnimationMixerLayer node. We’ll also give it a loopCount of 1 so the animation plays one time.
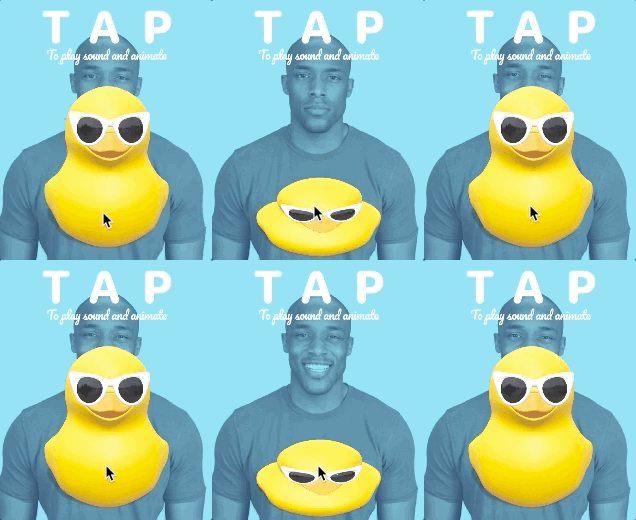
Then in our Lens in the preview panel, we can see the animation for this yellow duck gets played every time we tap on the screen.
Tap to Cycle Textures
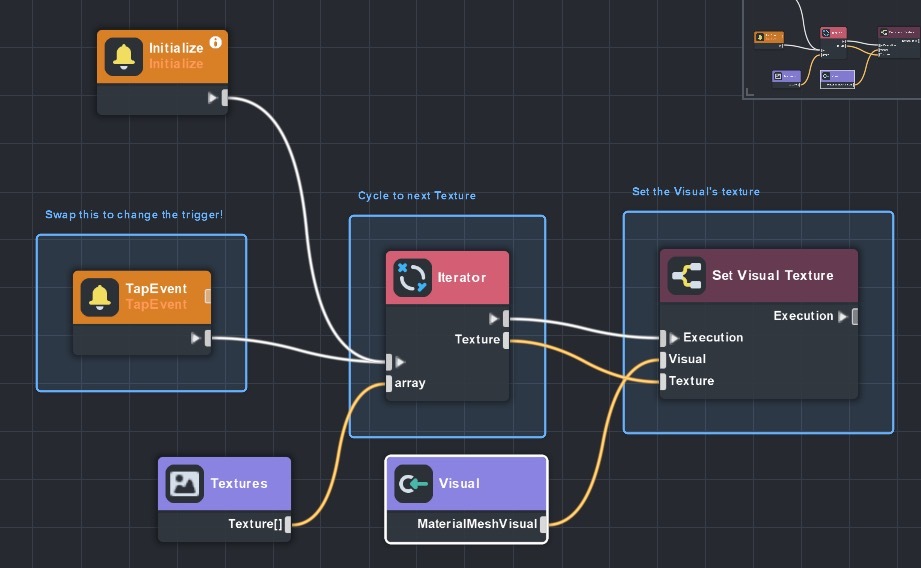
The Tap to Cycle Textures graph works with similar logic: User taps > calling the Iterator that loops through an array input > output result from the iterator to a SetVisualTexture node which sets the main texture of a MaterialMeshVisual element.
From the inspector we’ve inputted our Image object as its visual, and 3 different animal textures in the texture array.
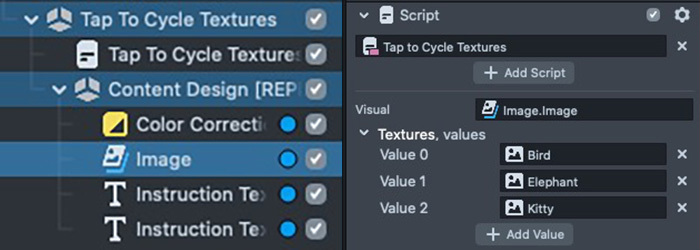
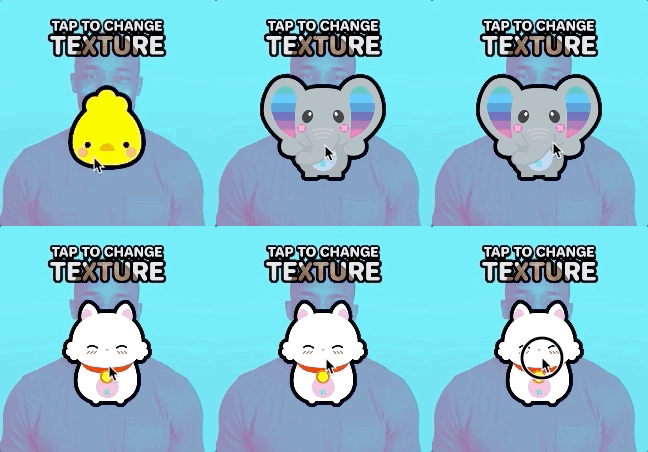
Then in our project, we can simply change the texture of this image by tapping the screen!
Complex Examples
Distance Check
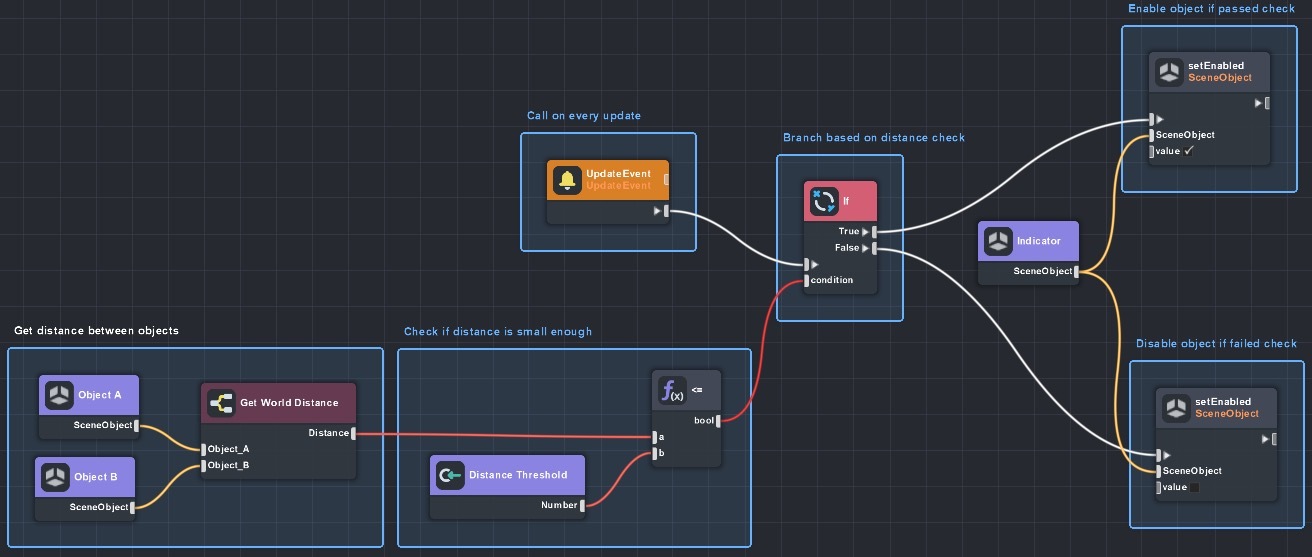
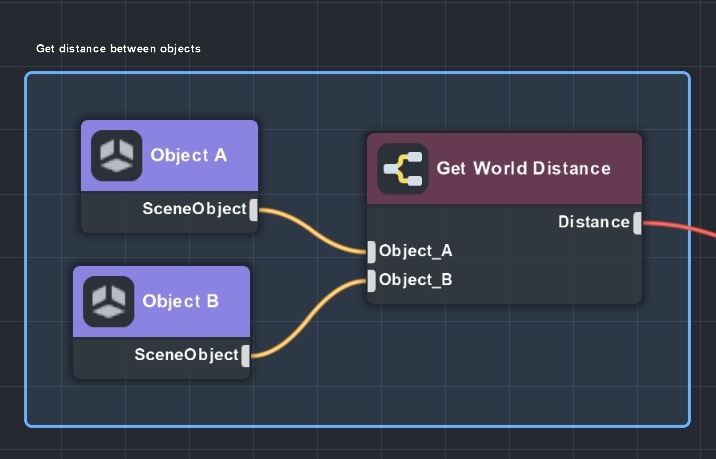
The Distance Check graph checks the distance between ObjectA and ObjectB with the GetWorldDistancenode. This node outputs a float which will be the value of the distance between ObjectA and ObjectB.
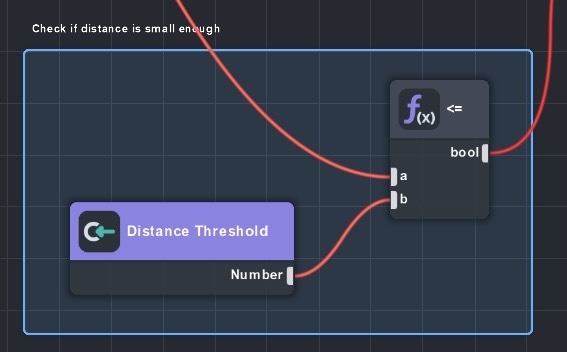
That value then gets sent to a node that compares number a and b and see if a is smaller or equals to b. It will send out a boolean value which will be true if a <= b, and false if a > b. In this case this boolean value will be true if ObjectA and ObjectB are closer than the Distance Threshold value, and false if they are further apart.
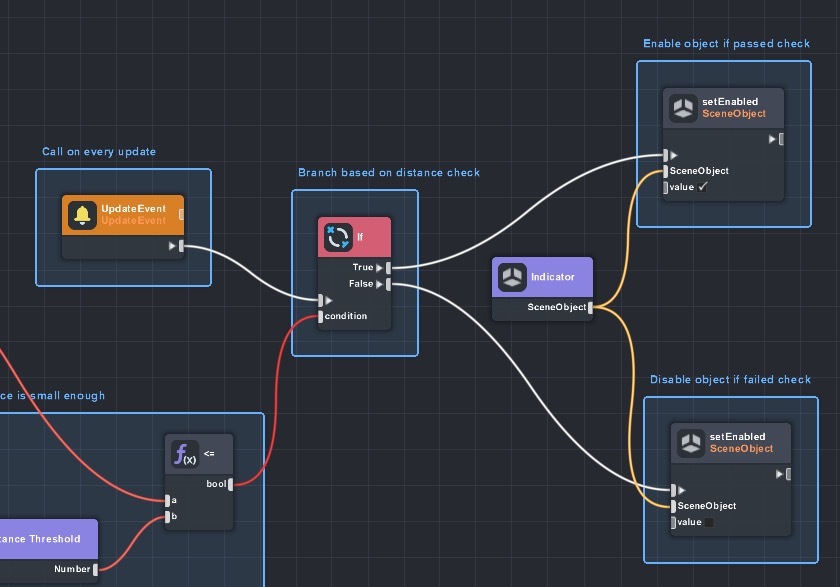
Then the boolean value will get passed to an if statement, and if the boolean value is true it will trigger the setEnabled node with default value of true so it will enable the Indicator object. If it is false, it will trigger the other setEnabled node with default value of false so it will disable the Indicator object.
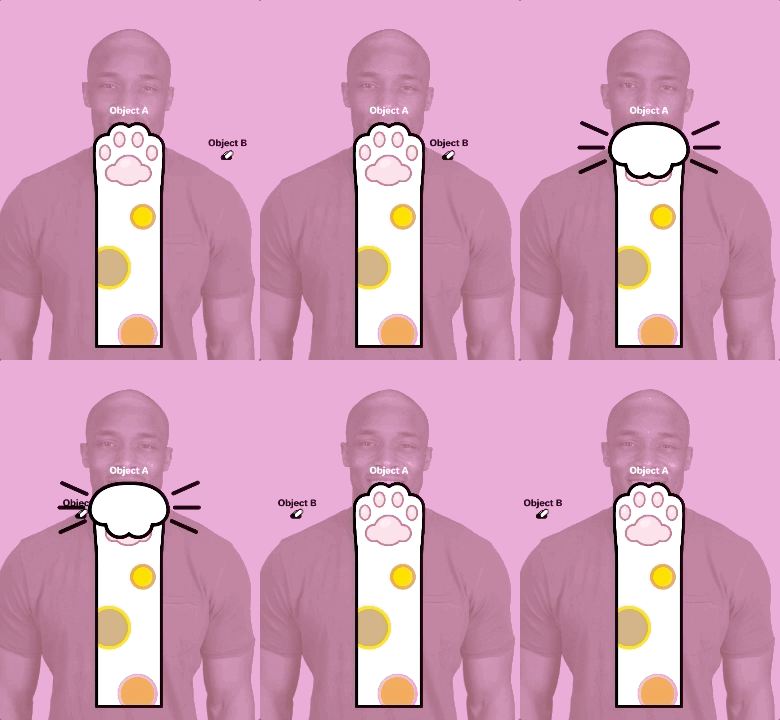
As a result, we can see the paw object in the middle of the screen gets enabled when the fly Object B is close to the paw center Object A.
Raycasting
Raycasting is a common way to detect touch position on 3D objects. The concept is that we shoot a straight line from wherever the user taps on the screen, which will shoot a ‘ray’ that is perpendicular to the camera plane. We detect where the touch is on the 3D object by calculating where the ray meets the 3D object based on the position and direction of the 3D object.
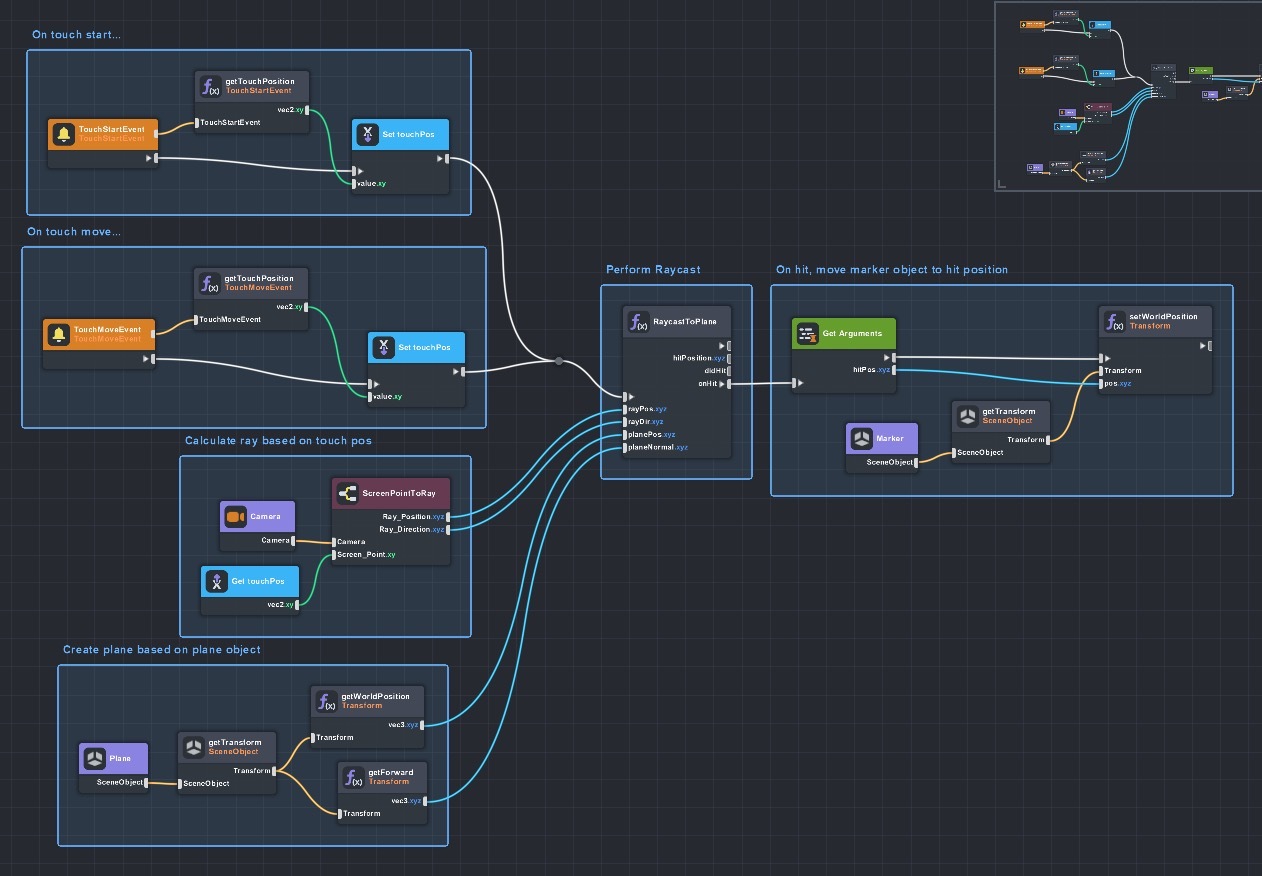
In this script graph example, we have variables which can be accessed with the getVariable node and its value can be set by the setVariable node.
First, we use the TouchStart and TouchMove event and the getTouchPosition node to get the currently touched position. Then we set it to our variable touchPos which is a vector2.
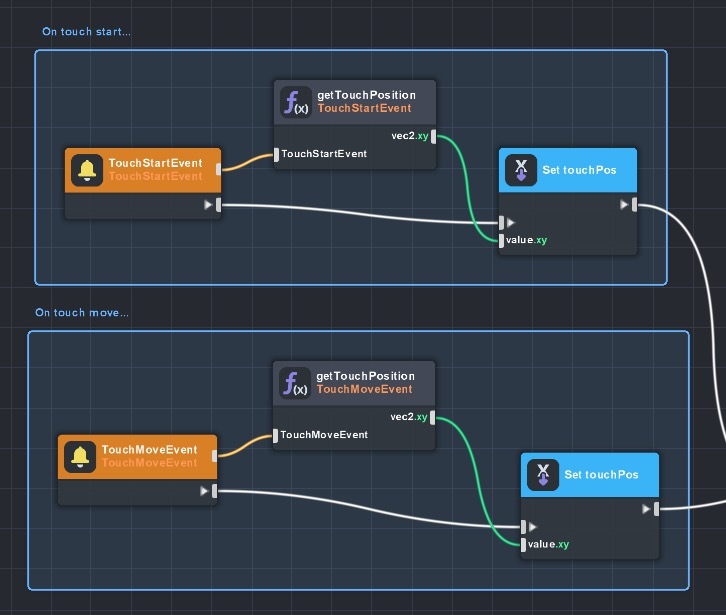
all variables can be accessed on the left hand of the script graph.

We’ll use the touchPos variable that we set with our touch events to get a ray that is perpendicular to the screen with the ScreenPointToRay node which outputs the position of the ray, and the direction it is facing.
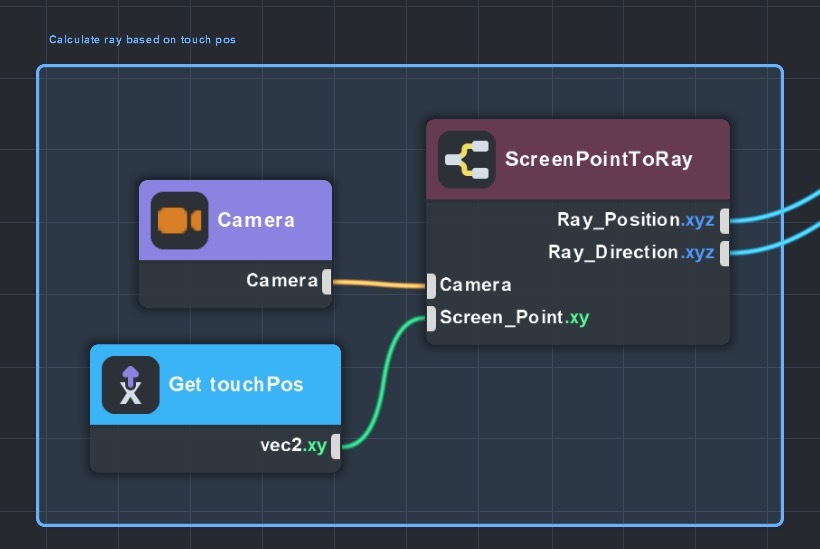
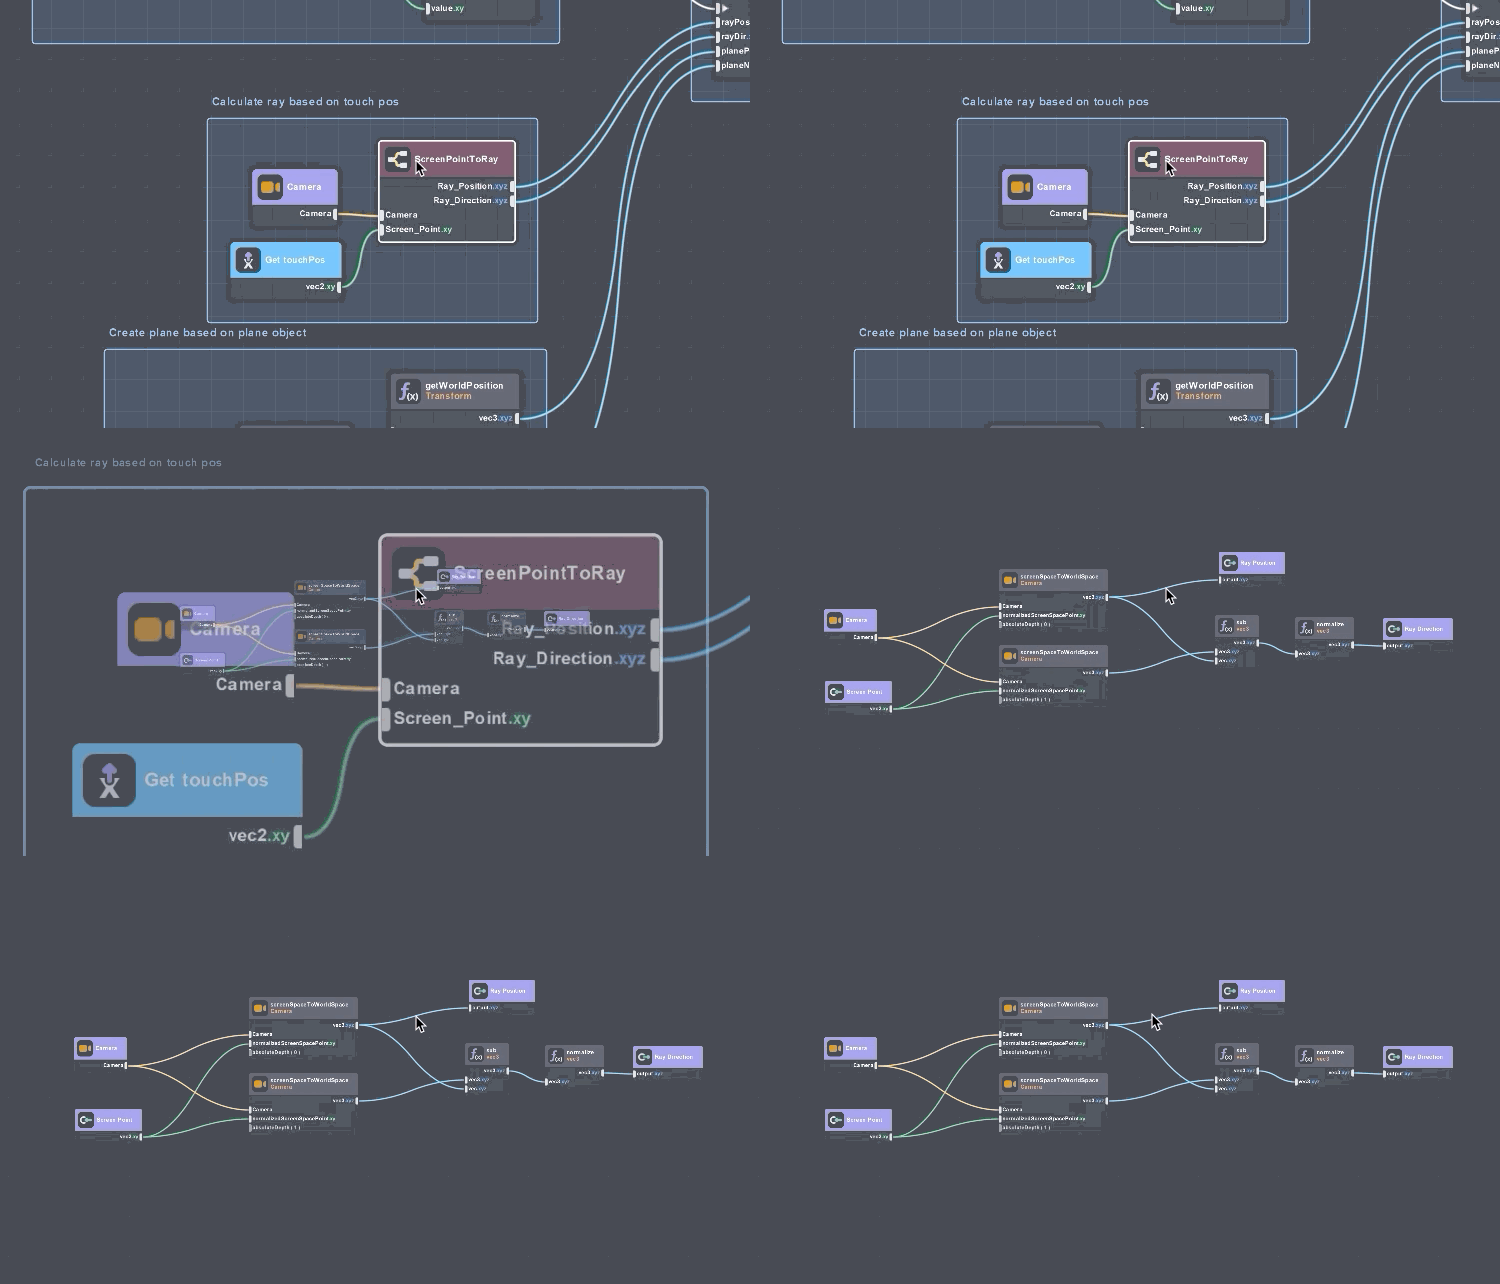
The ScreenPointToRay node is a subgraph which groups a graph together. You can double click on the ScreenPointToRay graph in order to see how the sub graph is built!
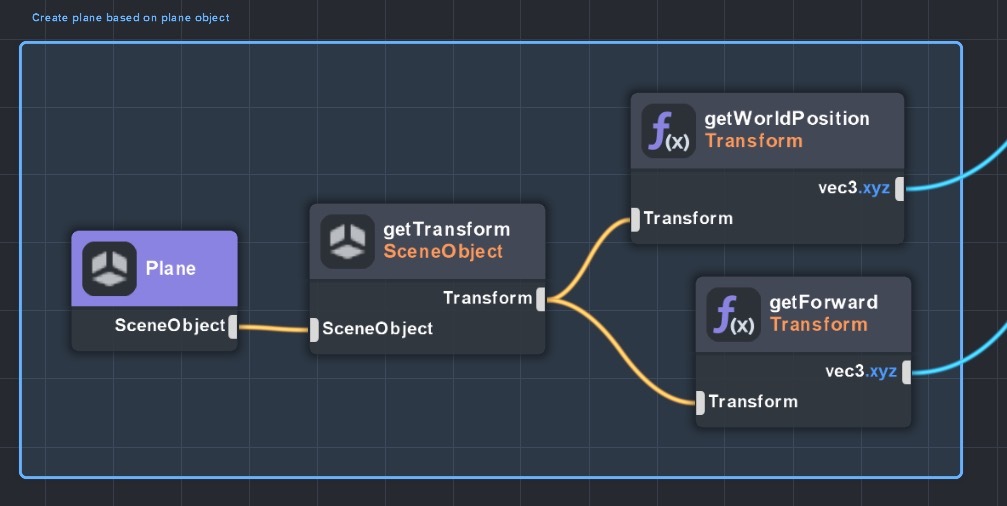
Next, we’ll input our plane object, and use getWorldPosition and getForward (get the forward direction) to output its position and direction.
Then we’ll input all the variables we got earlier, the position and direction of the ray, and position and direction of the plane to the RaycastToPlane function node. We link this function node with our Touch events, so this function will be called whenever a touch event happens.
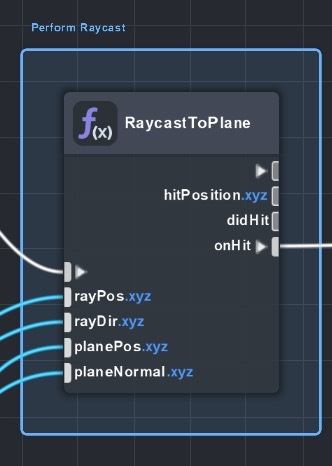
If we double click on the RaycastToPlane function node, we’ll see it’s a node made from a script.
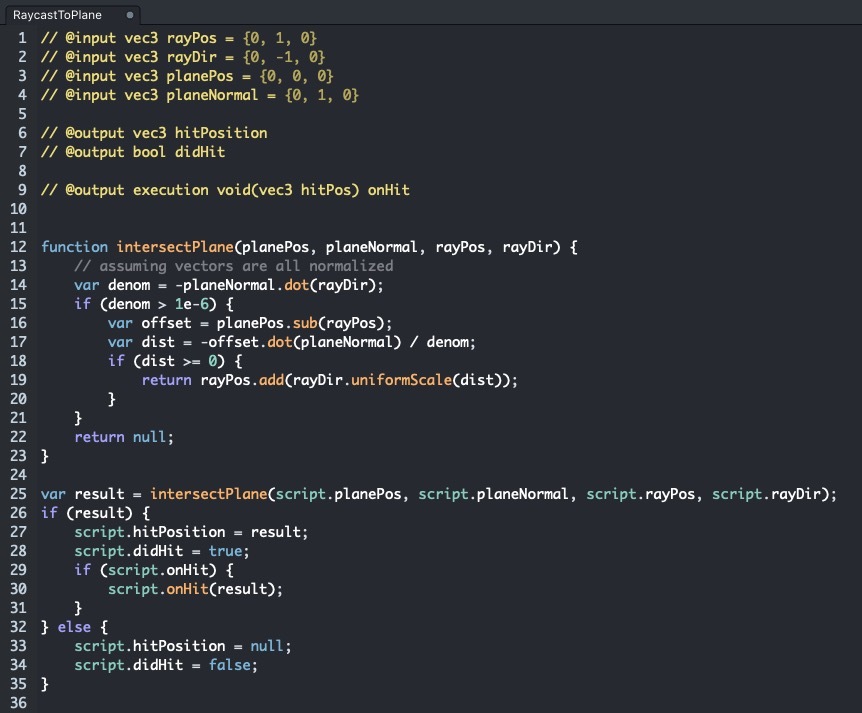
In this script we are basically processing inputs and returning an onHit function with a variable which will be the result of the intersectPlane function which takes all input of the position and normal (direction) of the ray and the plane.
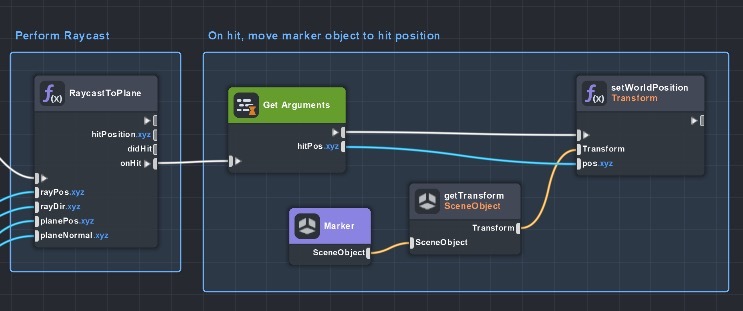
Then we’ll use the GetArguments node to get the argument in the hitPos variable from the function onHit. Then we’ll apply that position variable to our object Marker with the setWorldPosition node.
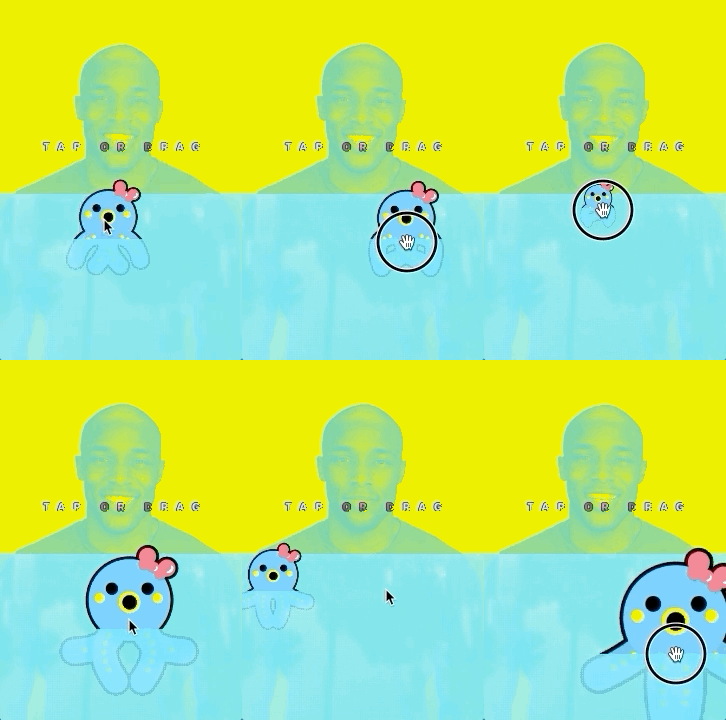
Then if we enable the Raycast to Plane Example under Complex Examples, we’ll see this blue creature will move to wherever we tap or drag on the plane.
Tween
Using Tween animations with the Script Graph
Tween animations are a powerful tool to achieve complicated animated effects without relying on a 3D program or using too much scripting.
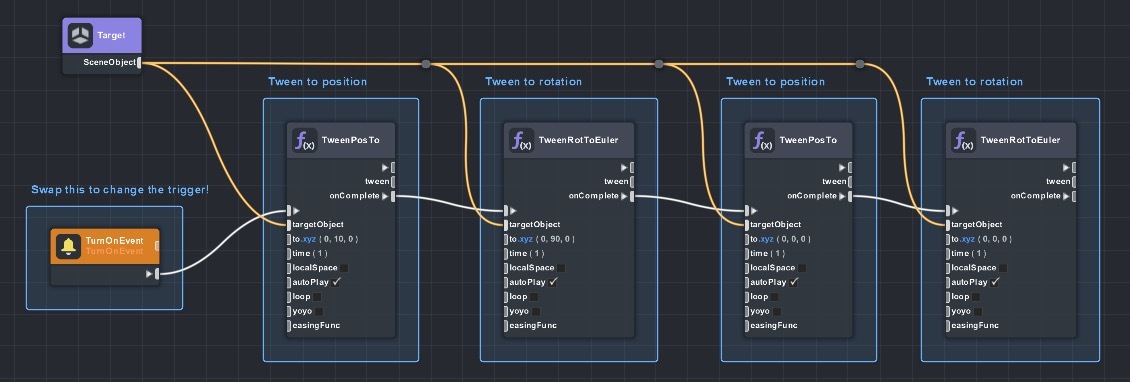
Let’s take a look at the Tween Simple example. This example animates a duck through a series of tween transform animations such as rotation transform, and position transform.

The script graph allows very easy setup with tween animations. Take a look at the Tween Simple example, this example plays a series of tweens after one another.
Random Tween Example
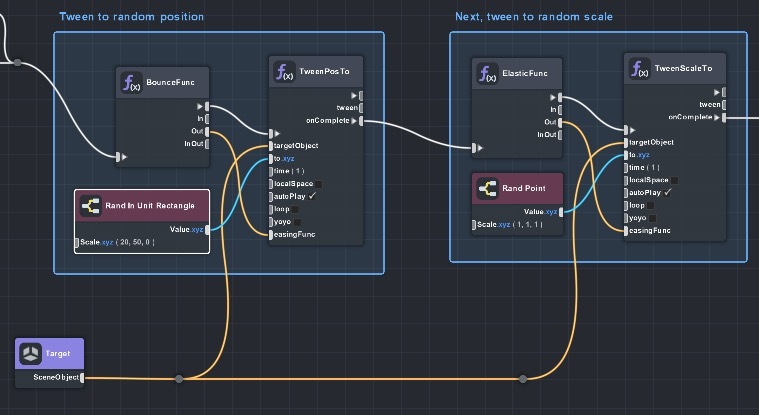
The Random Tween``Example randomizes the scale and position of an object within a certain range. This example demonstrates a powerful part of Visual Scripting where we can provide dynamic input to other parts of the Lens, like Tween.

To set it up with a script graph, we’ll put in random values generated by the random rectangle / point node into the target position / scale slot on the Tween node. Then we’ll have our random node generating a new position for us every time!
Behavior
Working with Behavior Script
Just as custom scripts can call Behavior triggers and add callback functions to Behavior triggers. The script graph can do the same.
Using Behavior script helps eliminate a lot of extra steps for some basic interactions and animations, we’ll take a look at some examples under the Behavior Examples parent, and see how Behavior script works with custom script graphs.
The primary way for Script Graphs and behavior scripts to communicate is to send and receive triggers. Each custom trigger will have its unique name. Both Behavior and Script Graphs can send and receive triggers.
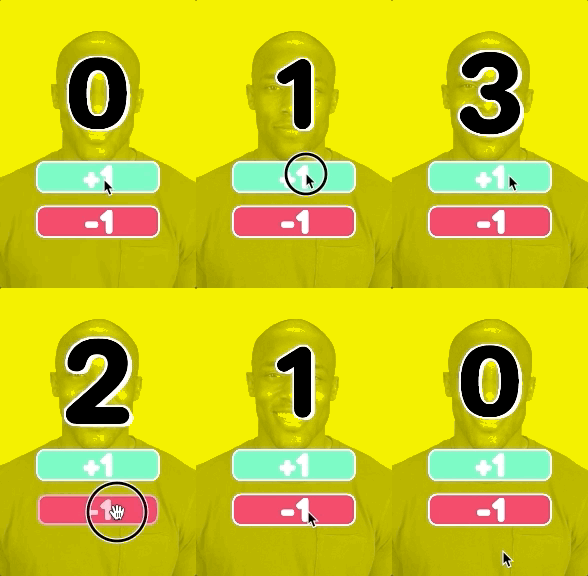
In the Custom Trigger Scoring Example, we’ll see that tapping on the +1 and -1 buttons will change the big number on the screen.
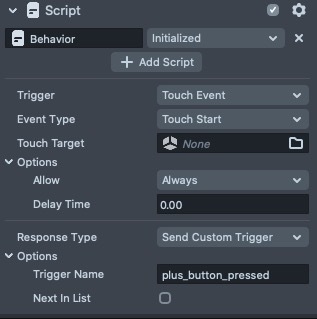
On the +1 and -1 buttons, we can find a Behavior script that’s sending out custom triggers ‘plus_button_pressed’ and ‘minus_button_pressed’.
We know these triggers will be sent out to the entire project when the related button is pressed. In the Custom Trigger Scoring Script Graph, we have 2 AddCustomTriggerResponse nodes with the corresponding triggerName.
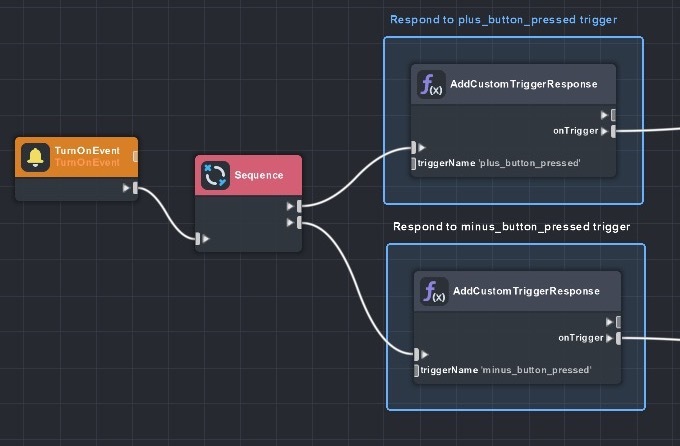
Inside each of the AddCustomTriggerResponse nodes, we’ll find out a very simple JavaScript that just outputs a function onTrigger that will be called when Behavior scripts send out its trigger.
Then, we’ll link each of the onTrigger function to a simple logic to add (or minus) 1 to the score variable.
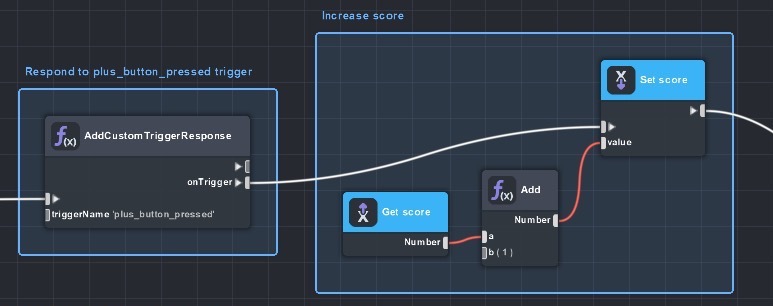
In the end, we’ll use the score variable to update the text input field. Then we’ll also send out a custom Behavior trigger ‘score_changed’ with a custom node SendCustomTrigger.
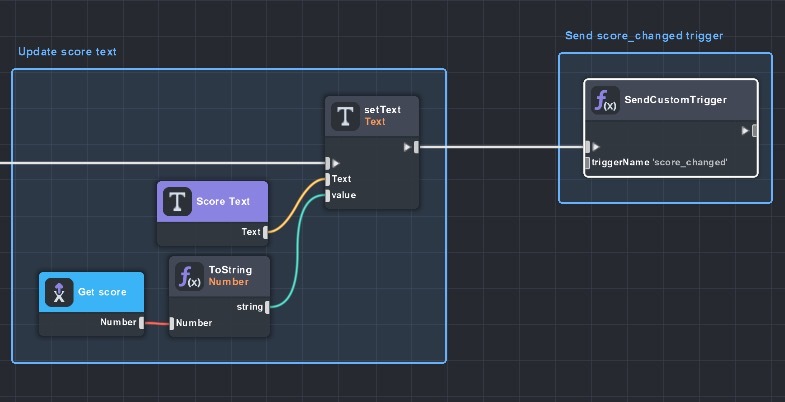
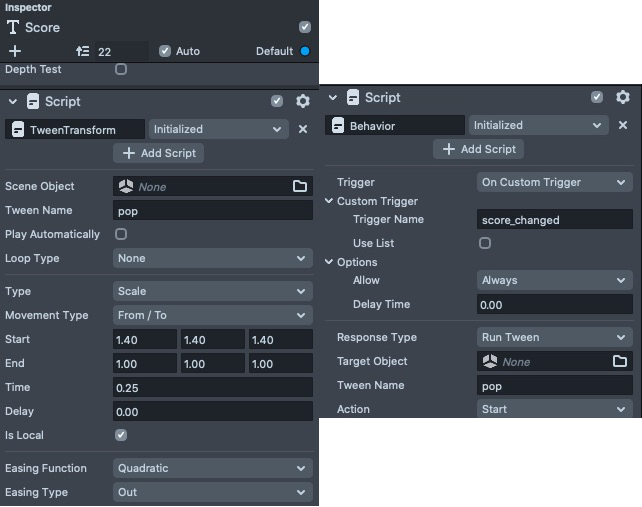
The reason we need to send out a custom trigger is to run a tween animation when the number on screen is changed. So we have a Tween + Behavior script combo set up on the Score object where the Behavior is set to be triggered by the trigger name ‘score_changed’.
Next Steps
The Script Graph can be used in so many different ways. This template scratches the surface of what is possible through Visual Scripting.
You can bring any of the logic you find in this template by right-clicking the object and choosing Export, and then Right-clicking in your projects Objects panel and choosing import.
In order to learn about all the features of visual scripting, different types of nodes, and other things you can do with it, check out the Visual Scripting guide!