External Debugger
Attach an external debugger to pause and inspect your Lens scripts while they run in a Lens Studio preview panel.
From a supported code editor or IDE you can set breakpoints, step through your script line by line, and inspect the call stack and variables, just like debugging any other JavaScript or TypeScript project.
This is the live debugging counterpart to Debugging with Logger. Reach for the Logger when you want quick print() or console.log() output, and for the debugger when you need to pause execution and inspect state.
This page covers debugging in a Lens Studio preview panel. To debug on a SPECS device, see the JavaScript Debugger guide in the SPECS developer docs.
Compatibility
You can attach a debugger from the following clients:
- VS Code, Cursor, and other VS Code forks. Requires Lens Studio 5.22 or later.
- IntelliJ IDEA and WebStorm. Requires Lens Studio 5.23 or later.
The debugger attaches to a Lens Studio preview panel and it connects over port 9222 on localhost.
Set the preview target
In Lens Studio, set the preview panel to No Simulation, Horizontal, or SPECS 27, or use the Interactive Preview.
VS Code, Cursor, and forks
- Open the same project folder that is open in Lens Studio.
- Open the Run and Debug view.
- Start the Lens Studio debug configuration by pressing F5 or running Start Debugging.
- If more than one target is available, select the preview to attach to from the list. When there is a single target, the debugger attaches to it automatically.
IntelliJ IDEA and WebStorm
-
Open the project folder, or a parent folder that contains it.
-
Create a new Attach to Node.js/Chrome run/debug configuration with Host set to
localhostand Port set to9222.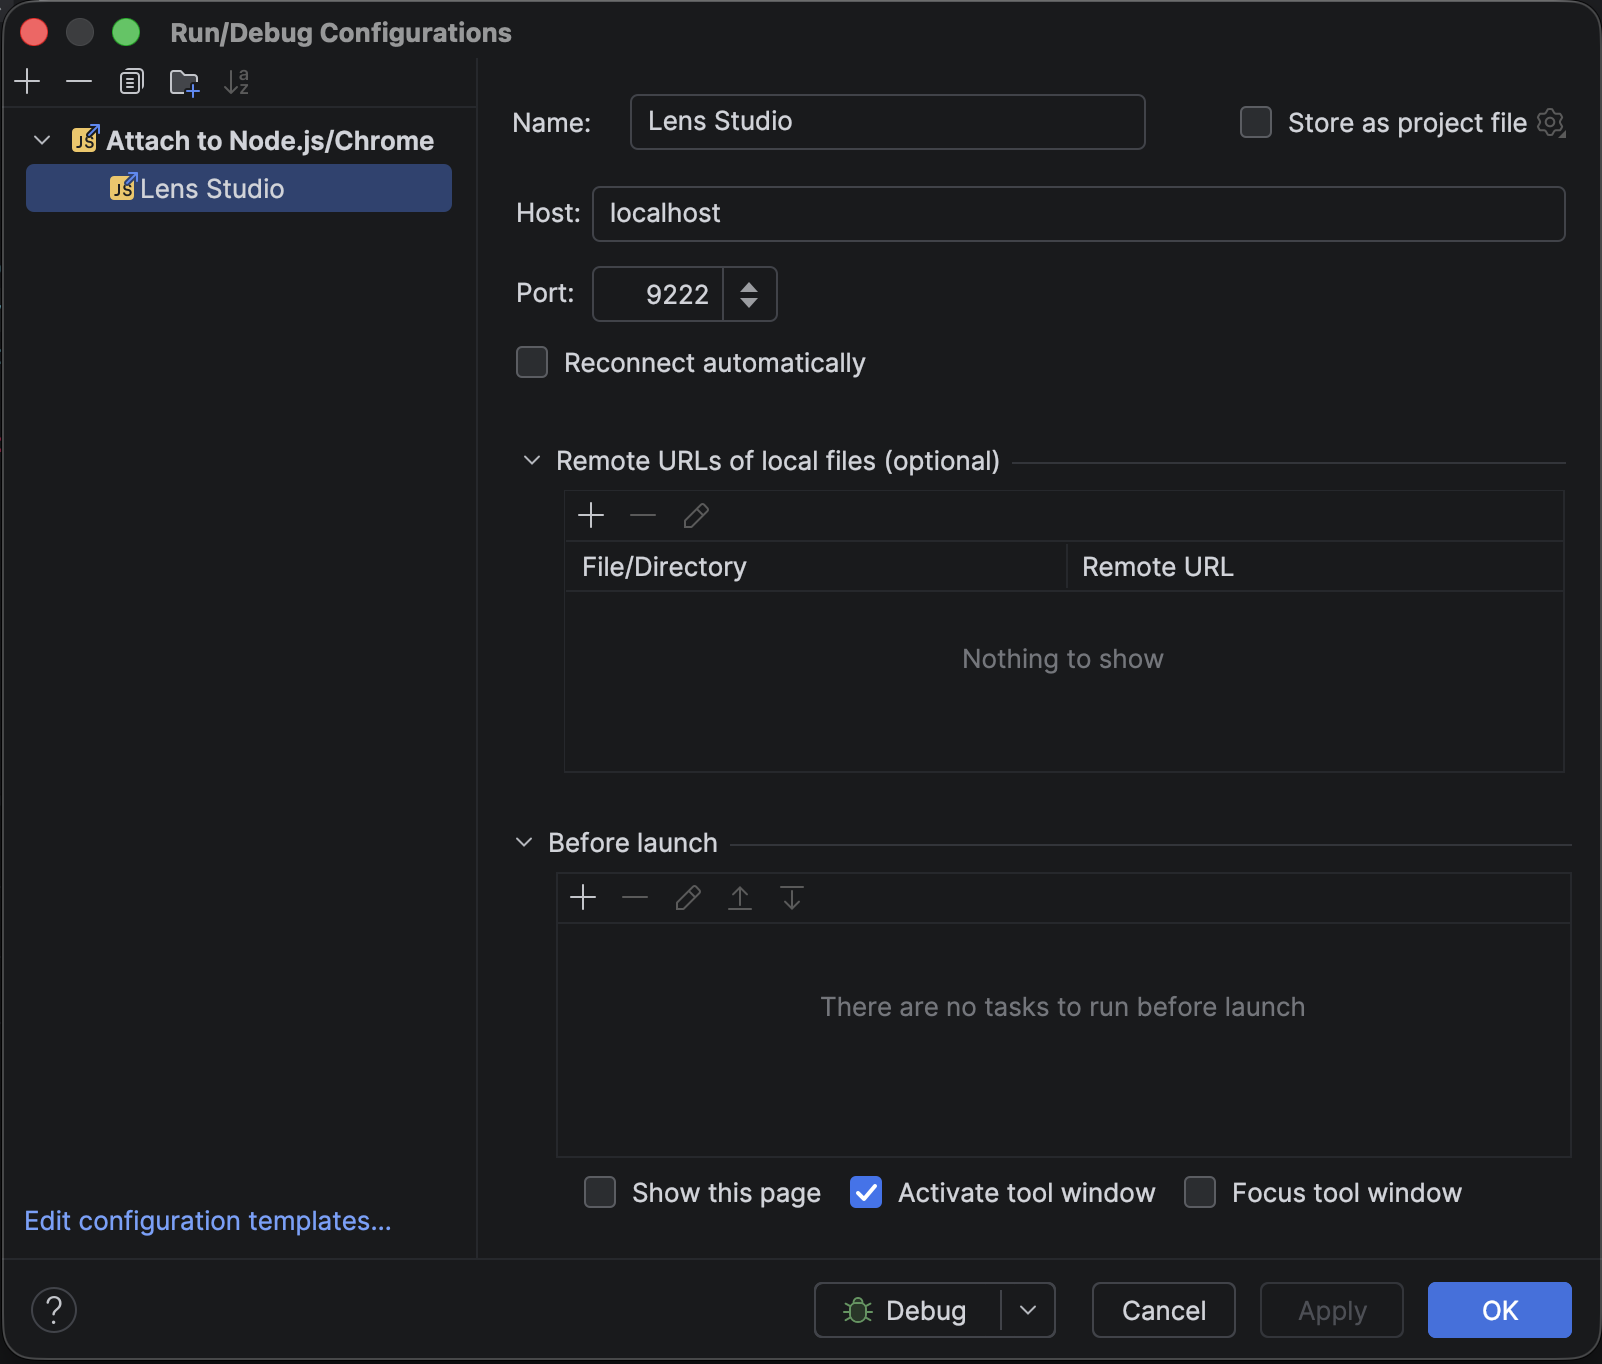
-
Run the configuration in Debug mode.
-
If more than one target is available, select the preview to attach to.
Once attached, set breakpoints, step through your code, and watch variables and the call stack as your Lens runs.
Hitting breakpoints in onAwake and top-level code
The debugger attaches to a Lens that is already running, so breakpoints in onAwake or in top-level script code won't be hit on the first run. To catch them:
- Attach the debugger to the running Lens.
- Set your breakpoints.
- Reload the Lens while keeping the debugger attached.
The JavaScript engine reruns every script from the beginning and stops at your breakpoints.
Things to keep in mind
- Stepping over
awaitstatements is not supported by the JS engine. As a workaround, set a breakpoint on the next line and resume. - The debugger only opens JS sources located in the project's
Assetsdirectory. To debug code inside a package, unpack it for editing first. - The Stop Preview button on a preview panel toolbar is not a debugger pause, it does not trigger a debugger pause.
- Switching to a different workspace in Lens Studio ends the debug sessions for all current preview panels.
- In VS Code, if a list of targets appears, and you click elsewhere, the list is dismissed and the debugger attaches to all targets at once. This is a VS Code behavior with no workaround.
- Only one Lens Studio instance at a time is supported. A second instance can't start the debug server because the first one is already using the port.